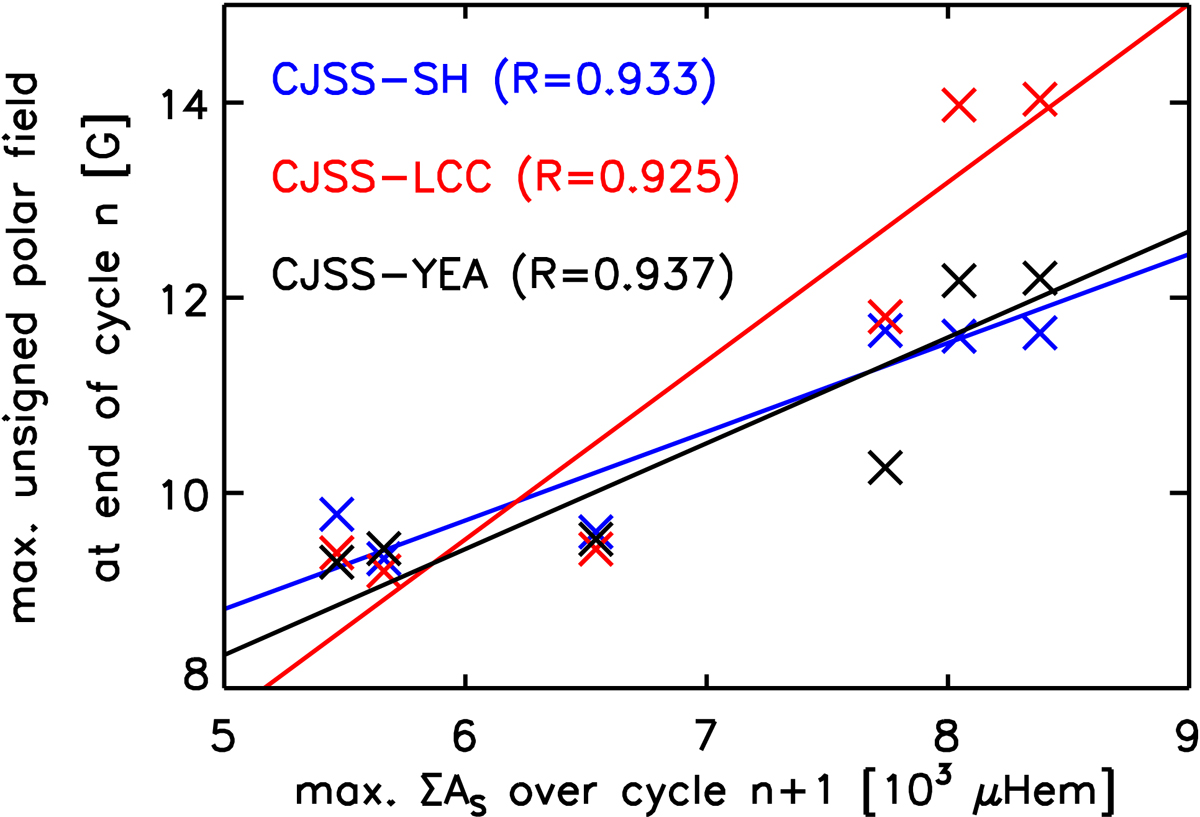
Fig. 4.
Download original image
For each simulation run, the peak of the mean unsigned magnetic flux density over the polar caps at the end of solar cycle n vs the maximum total surface coverage by sunspots over cycle n + 1, where n ranges from 15 to 21. We excluded solar cycle 14 as the end of this cycle occurred at the start of the simulation, and is therefore sensitive to the arbitrary initial condition. The crosses and lines denote the individual cycle values and the corresponding linear fit. The Pearson’s correlation coefficient, R, is indicated (see Sect. 3.2.3 for details).
Current usage metrics show cumulative count of Article Views (full-text article views including HTML views, PDF and ePub downloads, according to the available data) and Abstracts Views on Vision4Press platform.
Data correspond to usage on the plateform after 2015. The current usage metrics is available 48-96 hours after online publication and is updated daily on week days.
Initial download of the metrics may take a while.