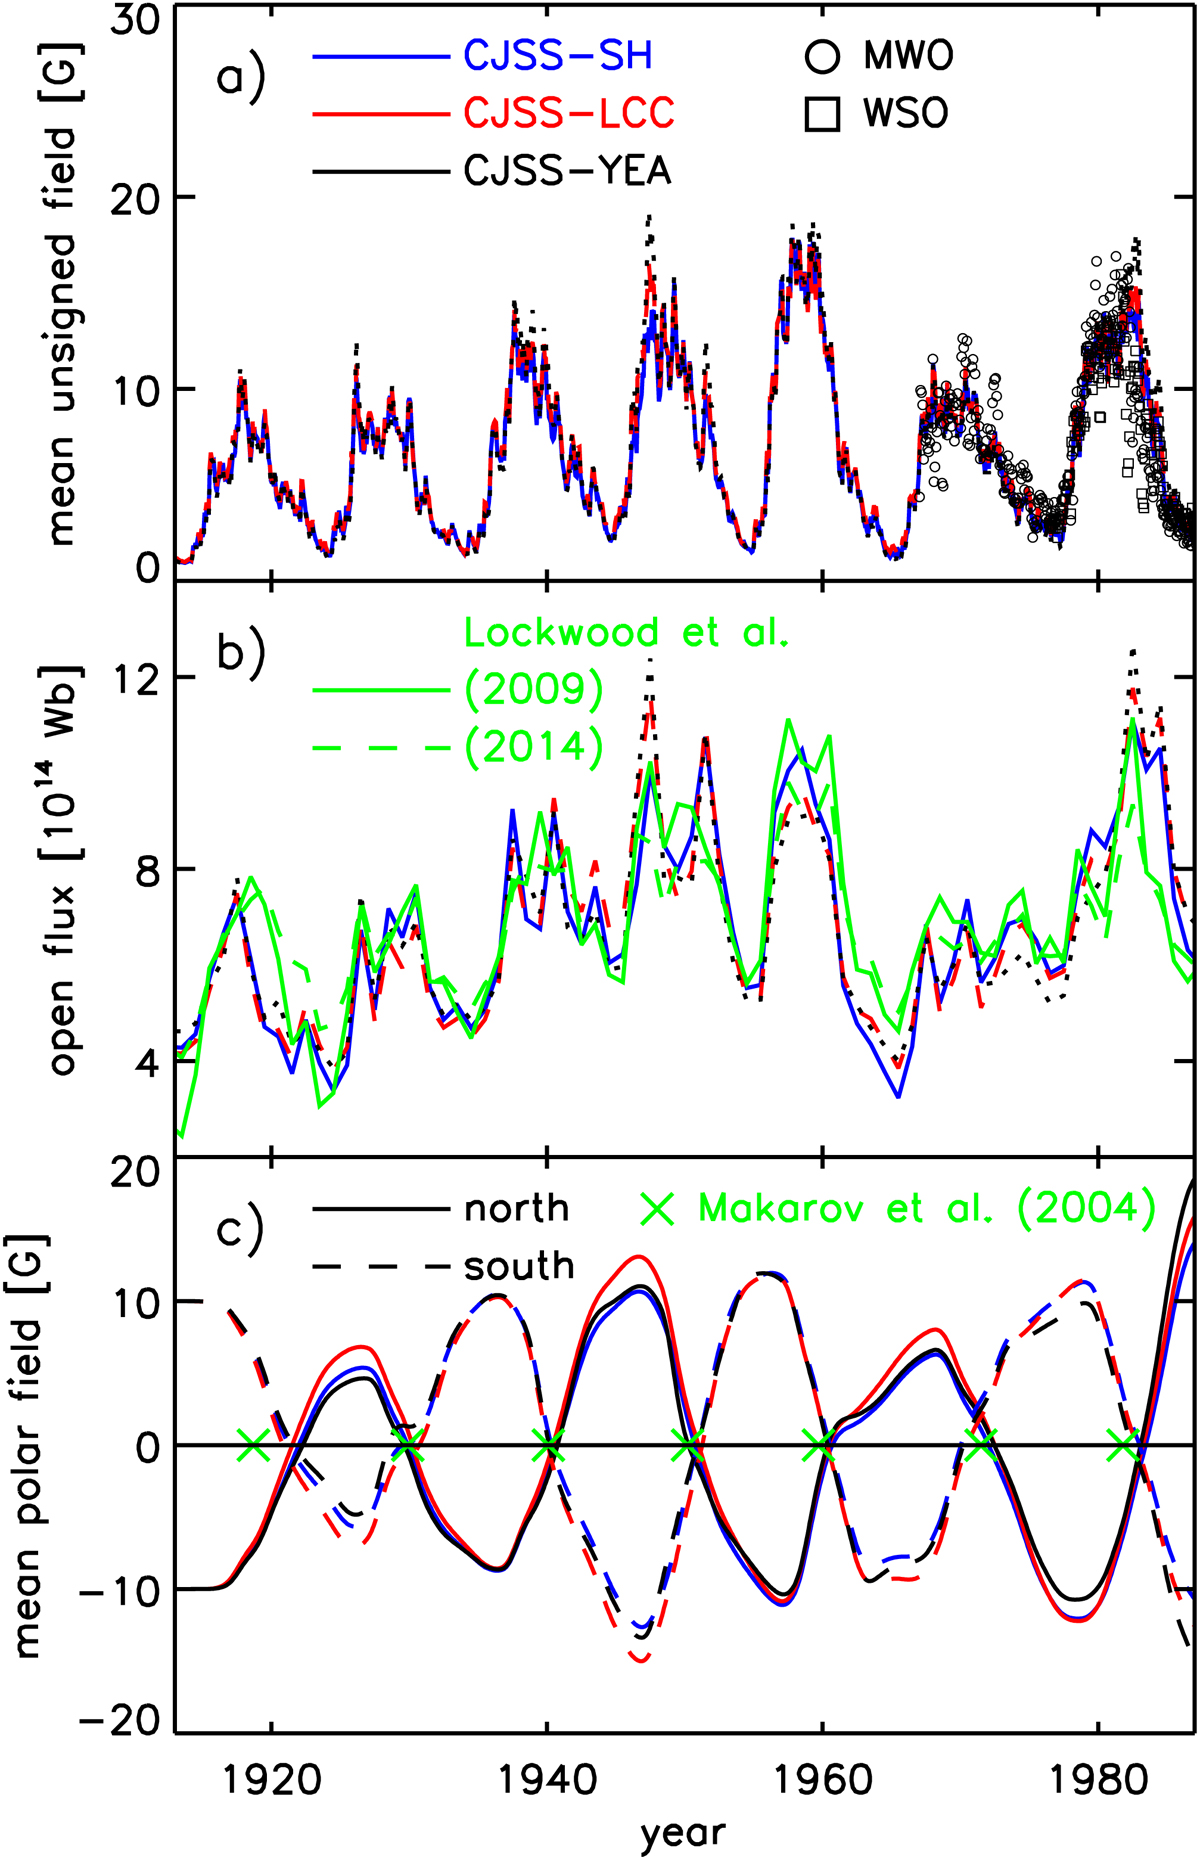
Fig. 3.
Download original image
Surface flux transport simulation runs. (a) Average unsigned photospheric magnetic flux density in the CJSS-SH (blue), CJSS-LCC (red), and CJSS-YEA (black) simulation runs (Table 1). The CJSS-SH and CJSS-LCC time series are largely hidden by the CJSS-YEA time series due to the close similarity. The circles and squares denote the observed values from MWO and WSO (Arge et al. 2002). (b) Open flux corresponding to each run, derived by extrapolating the model output photospheric magnetic field into the heliosphere, and the reconstruction of this quantity from the aa index by Lockwood et al. (2009) (green solid line) and by Lockwood et al. (2014) (green dashed line). In (a) and (b) the CJSS-LCC and CJSS-YEA time series are dashed and dotted, respectively, to aid visibility. (c) Mean magnetic field over the north (solid lines) and the south polar caps (dashed lines) in each run. The green crosses indicate the observed timing of the polar field reversals reported by Makarov et al. (2004) (see Sects. 3.1 and 3.2 for details).
Current usage metrics show cumulative count of Article Views (full-text article views including HTML views, PDF and ePub downloads, according to the available data) and Abstracts Views on Vision4Press platform.
Data correspond to usage on the plateform after 2015. The current usage metrics is available 48-96 hours after online publication and is updated daily on week days.
Initial download of the metrics may take a while.