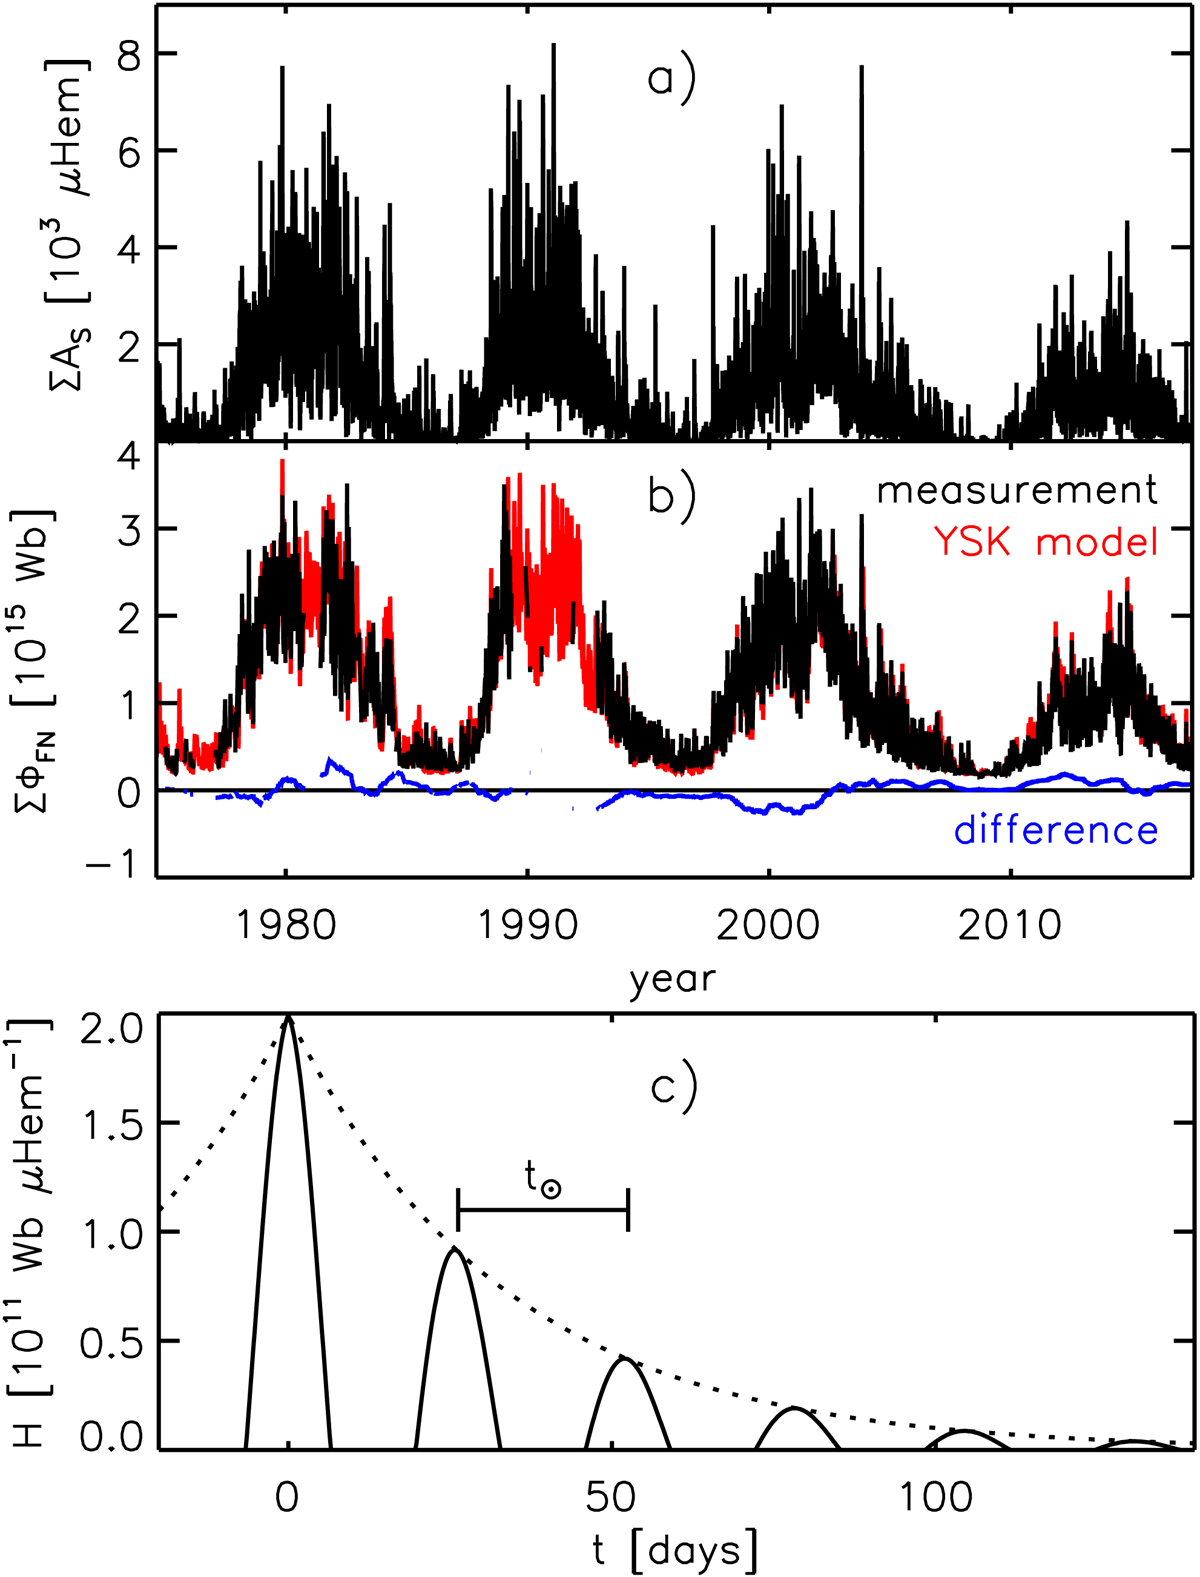
Fig. 1.
Download original image
Observed ΣAS and ΣΦFN, YSK model (Eq. (1)) reconstruction of ΣΦFN from ΣAS and H term in this model (Eq. (2)). (a) Composite time series of the total surface coverage by sunspots, ΣAS, by Balmaceda et al. (2009). (b) Composite time series of the disc-integrated facular and network magnetic flux, ΣΦFN, by Yeo et al. (2014b) (black), the reconstruction of this quantity from ΣAS with the YSK model (red), and the 365-day running mean of the difference between measurement and model (blue). The Balmaceda et al. (2009) time series goes back to 1874 but the range of the plot is confined to 1974 to 2017, the period where it overlaps with the Yeo et al. (2014b) time series. The gaps in the Yeo et al. (2014b) time series correspond to periods where there no suitable magnetogram observations with which to determine ΣΦFN were available. (c) The H term, which describes the response of ΣΦFN to the appearance of a sunspot per unit sunspot area. The dotted line follows the exponential envelope of H and t⊙ denotes the synodic rotation period of the Sun (see Sect. 2.1 for details).
Current usage metrics show cumulative count of Article Views (full-text article views including HTML views, PDF and ePub downloads, according to the available data) and Abstracts Views on Vision4Press platform.
Data correspond to usage on the plateform after 2015. The current usage metrics is available 48-96 hours after online publication and is updated daily on week days.
Initial download of the metrics may take a while.