Free Access
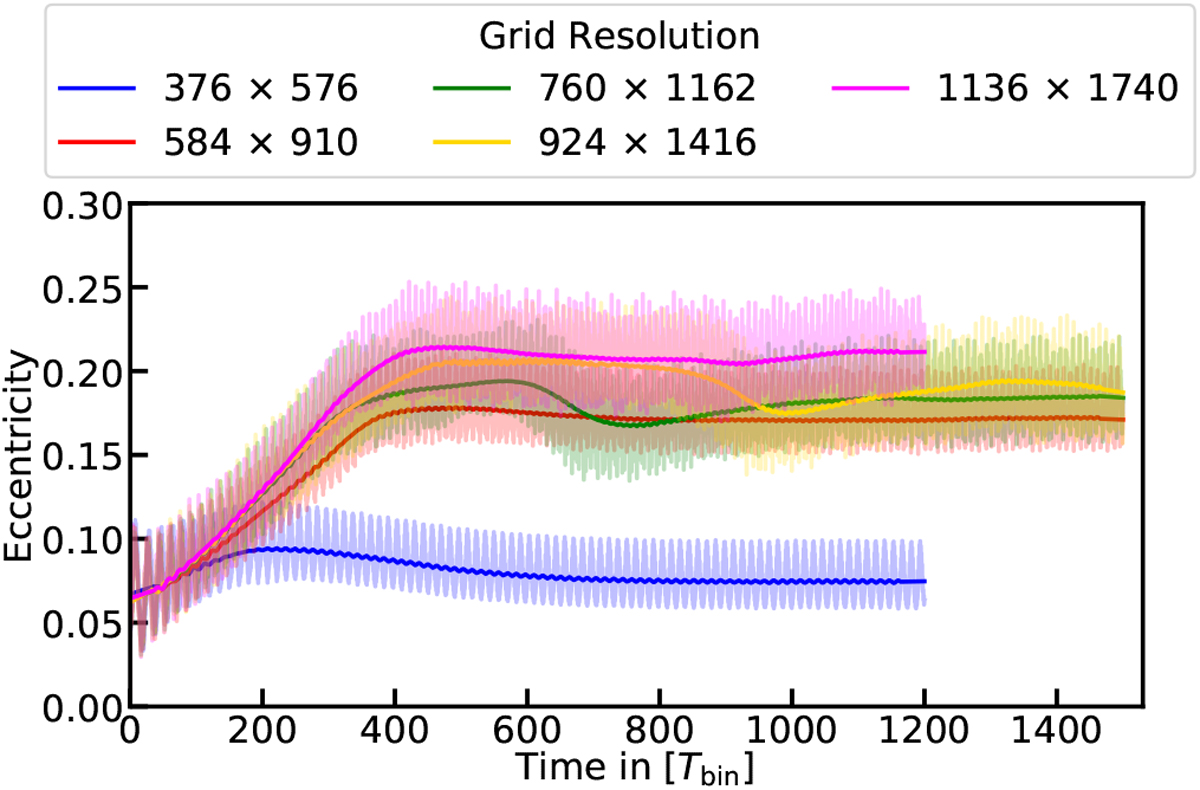
Fig. 4
Download original image
Time evolution of the mass-weighted disk eccentricity (see Eq. (3)) for different resolutions for a logarithmic grid. Solid lines are time averaged values while the transparent lines are the simulation data.
Current usage metrics show cumulative count of Article Views (full-text article views including HTML views, PDF and ePub downloads, according to the available data) and Abstracts Views on Vision4Press platform.
Data correspond to usage on the plateform after 2015. The current usage metrics is available 48-96 hours after online publication and is updated daily on week days.
Initial download of the metrics may take a while.