Fig. 17
Download original image
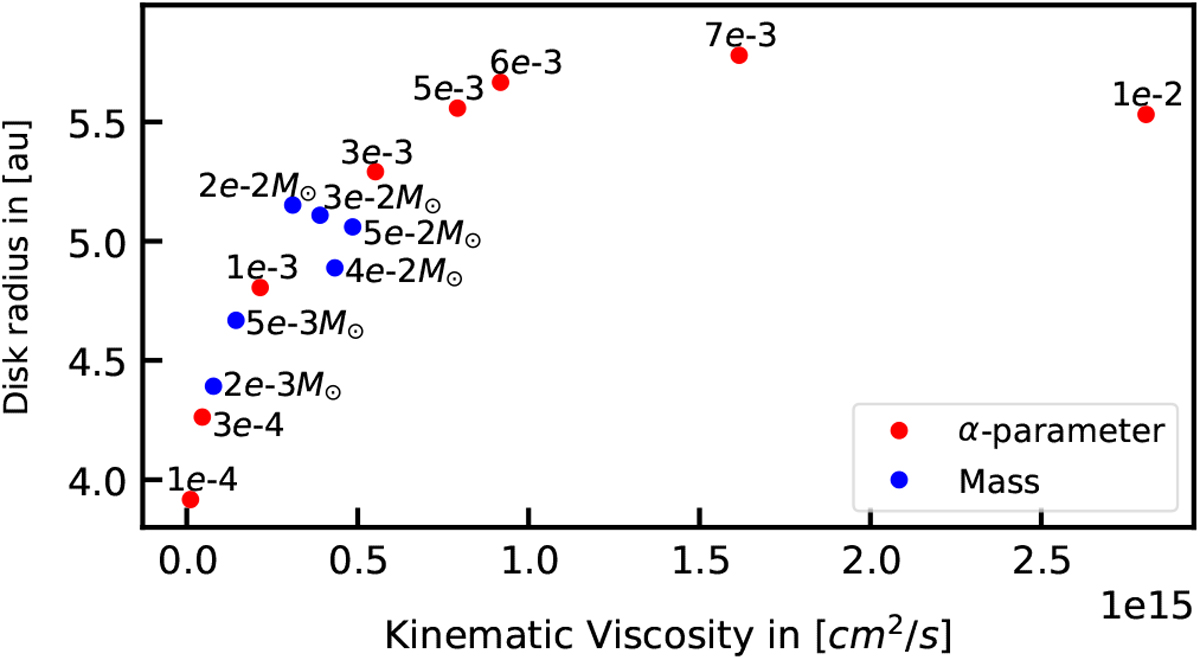
Precession rate plotted against the mass-weighted disk aspect ratio. Red dots mark the simulations with different α values, blue dots with different disk masses and magenta dots with different cooling factors and lower resolution. The green line is a quadratic fit through the data points. The precession rate depends linearly on the disk Temperature with T ∝ h2.
Current usage metrics show cumulative count of Article Views (full-text article views including HTML views, PDF and ePub downloads, according to the available data) and Abstracts Views on Vision4Press platform.
Data correspond to usage on the plateform after 2015. The current usage metrics is available 48-96 hours after online publication and is updated daily on week days.
Initial download of the metrics may take a while.