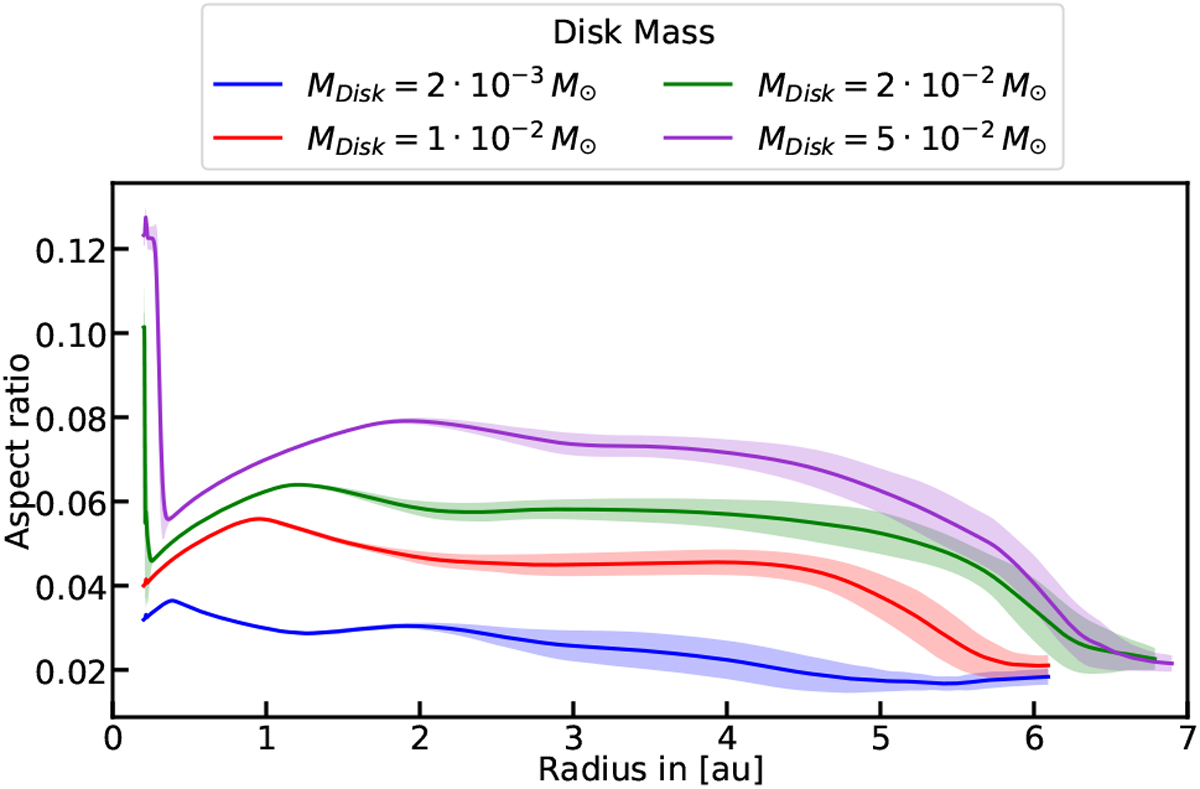
Fig. 10
Download original image
Radial profiles of the time averaged mass-weighted disk scale height, here h = H∕r, for different initial disk masses. Solid lines are averaged over 200 snapshots taken at binary apastron during the simulation time from 1300 Tbin to 1500 Tbin. The shaded areas show the 1 σ variations. The radial profiles are cut at a radius where the time averaged surface density drops below 100 times the floor value.
Current usage metrics show cumulative count of Article Views (full-text article views including HTML views, PDF and ePub downloads, according to the available data) and Abstracts Views on Vision4Press platform.
Data correspond to usage on the plateform after 2015. The current usage metrics is available 48-96 hours after online publication and is updated daily on week days.
Initial download of the metrics may take a while.