Fig. 1
Download original image
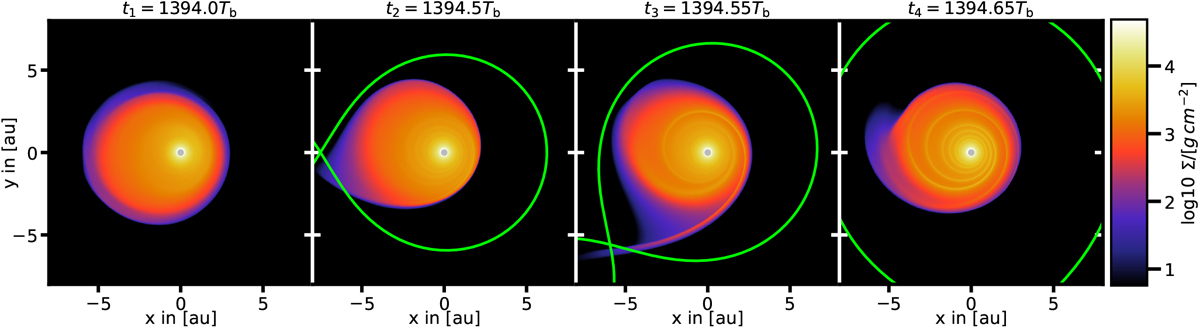
Disk surface density during one binary orbit for the standard parameters, see Table 1, after the equilibrium has been reached. The green line indicates the Roche lobes of the stars. In the leftmost image (t1) the binary is at apastron and the disk is unperturbed. At the binary’s periastron (t2) the diskis maximally distorted and has the highest eccentricity. After the periastron passage (t3) two spiral arms are launched that wind inward and dissipate again (t4). Most of the disk’s mass loss happens in the time frame between t2 and t4 that spans 15% of the binary’s period.
Current usage metrics show cumulative count of Article Views (full-text article views including HTML views, PDF and ePub downloads, according to the available data) and Abstracts Views on Vision4Press platform.
Data correspond to usage on the plateform after 2015. The current usage metrics is available 48-96 hours after online publication and is updated daily on week days.
Initial download of the metrics may take a while.