Fig. 1
Download original image
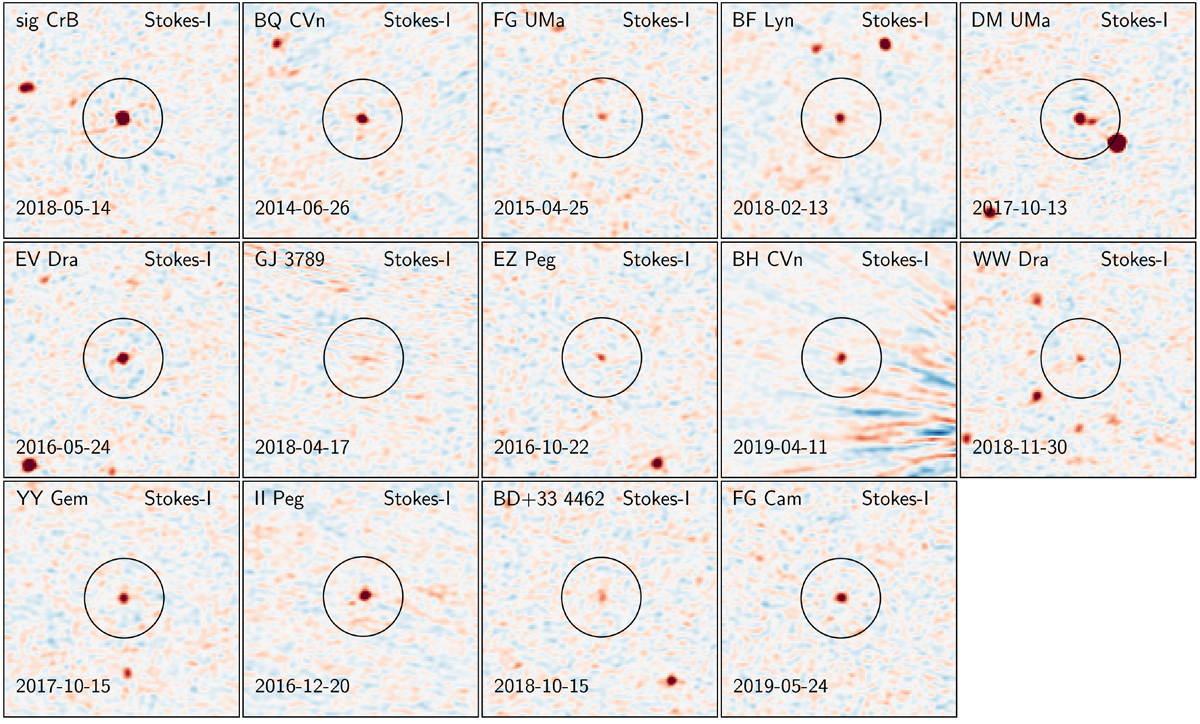
Stokes I discovery images of our RS CVn population. Each panel is a zoom-in of a LoTSS pipeline-produced image of the field containing the target. The circles are centred on the proper-motion corrected position of the targets and have a radius of 30″. The point spread function is about 5″ wide. The color scale runs from −15 (blue), through 0 (white), to + 15 (red) median absolute deviations, which corresponds to a range of −10σ to + 10σ for Gaussian noise. The date reported in each panel is the date of observation in YYYY-MM-DD format.
Current usage metrics show cumulative count of Article Views (full-text article views including HTML views, PDF and ePub downloads, according to the available data) and Abstracts Views on Vision4Press platform.
Data correspond to usage on the plateform after 2015. The current usage metrics is available 48-96 hours after online publication and is updated daily on week days.
Initial download of the metrics may take a while.