Fig. 2
Download original image
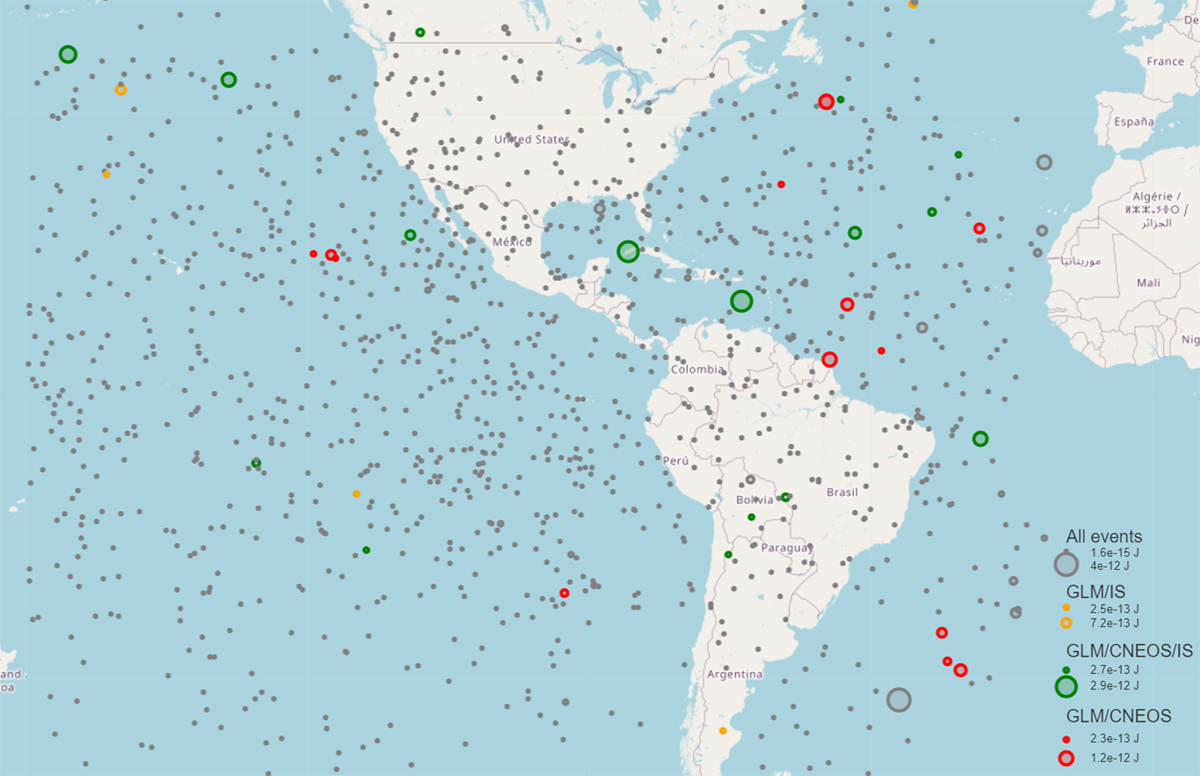
Map of all fireball detections in the GLM database, status as of 9 November 2020. The size of the dots correlates with the peak energy of the event in joules in log scale. The grey dots represent the fireball events in the database, including the 50 brightest events that were more closely investigated and only observed by GLM. The yellow dots show only those events that were also found in the infrasound data, and the red ones show the events that were both found by GLM and are in the CNEOS database. The green dots represent events that were detected by all three methods.
Current usage metrics show cumulative count of Article Views (full-text article views including HTML views, PDF and ePub downloads, according to the available data) and Abstracts Views on Vision4Press platform.
Data correspond to usage on the plateform after 2015. The current usage metrics is available 48-96 hours after online publication and is updated daily on week days.
Initial download of the metrics may take a while.