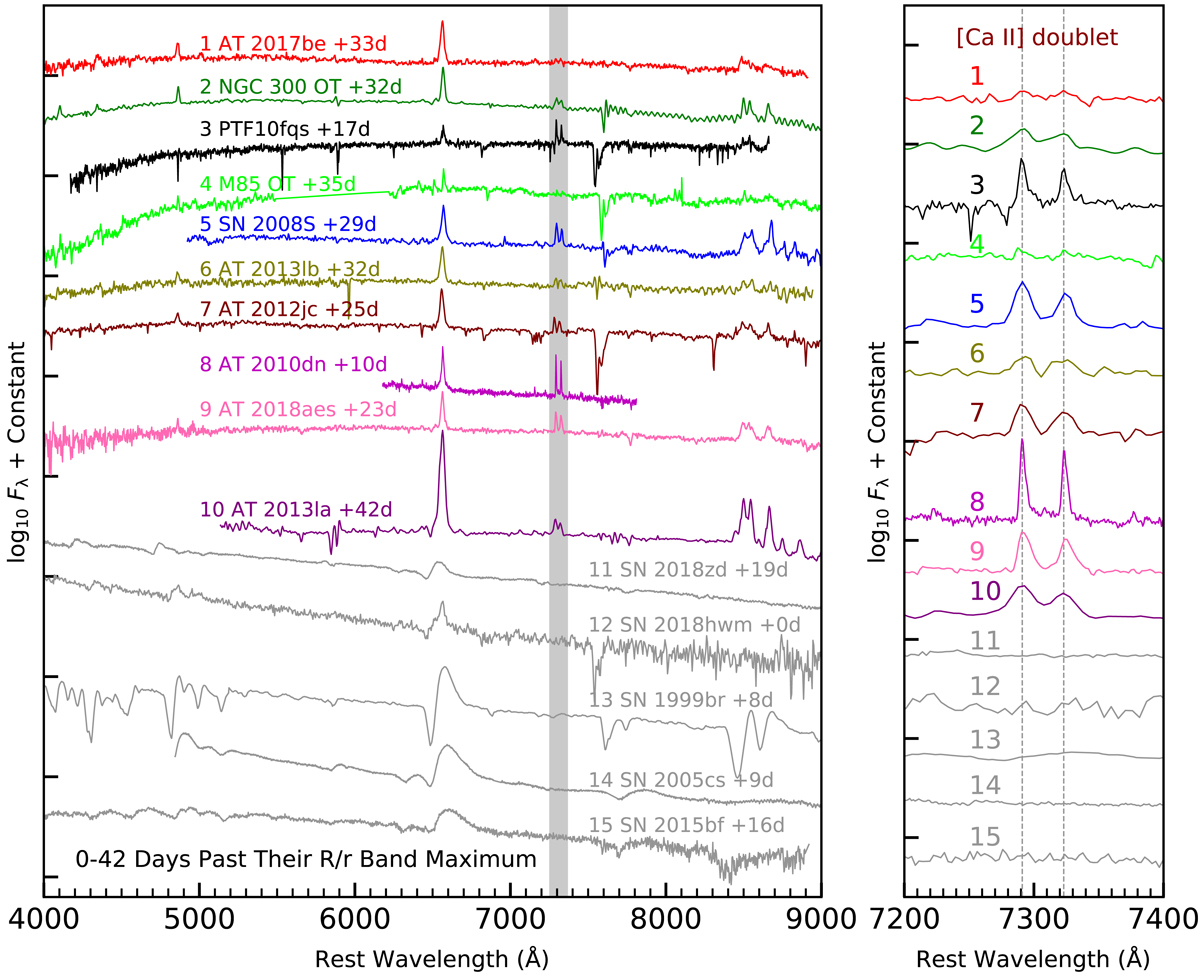
Fig. 9.
Download original image
Spectral comparison of a sample of ILRTs and SN 2018zd, SN 2018hwm, SN 2015bf, SN 1999br, and SN 2005cs. The spectra of M85 OT, SN 2008S, PTF10fqs, AT 2017be, SN 2018zd, SN 2018hwm, SN 2015bf, SN 1999br, and SN 2005cs are taken from Kulkarni et al. (2007), Botticella et al. (2009), Kasliwal et al. (2011), Cai et al. (2018), Zhang et al. (2020), Reguitti et al. (2021), Lin et al. (2021), Pastorello et al. (2004), and Pastorello et al. (2006, 2009). The right panel shows the region of [Ca II], marked with the grey-shaded region in the left panel. All spectra were obtained at similar epochs from the R/r-band maxima, and were corrected for redshift and reddening.
Current usage metrics show cumulative count of Article Views (full-text article views including HTML views, PDF and ePub downloads, according to the available data) and Abstracts Views on Vision4Press platform.
Data correspond to usage on the plateform after 2015. The current usage metrics is available 48-96 hours after online publication and is updated daily on week days.
Initial download of the metrics may take a while.