Fig. 7.
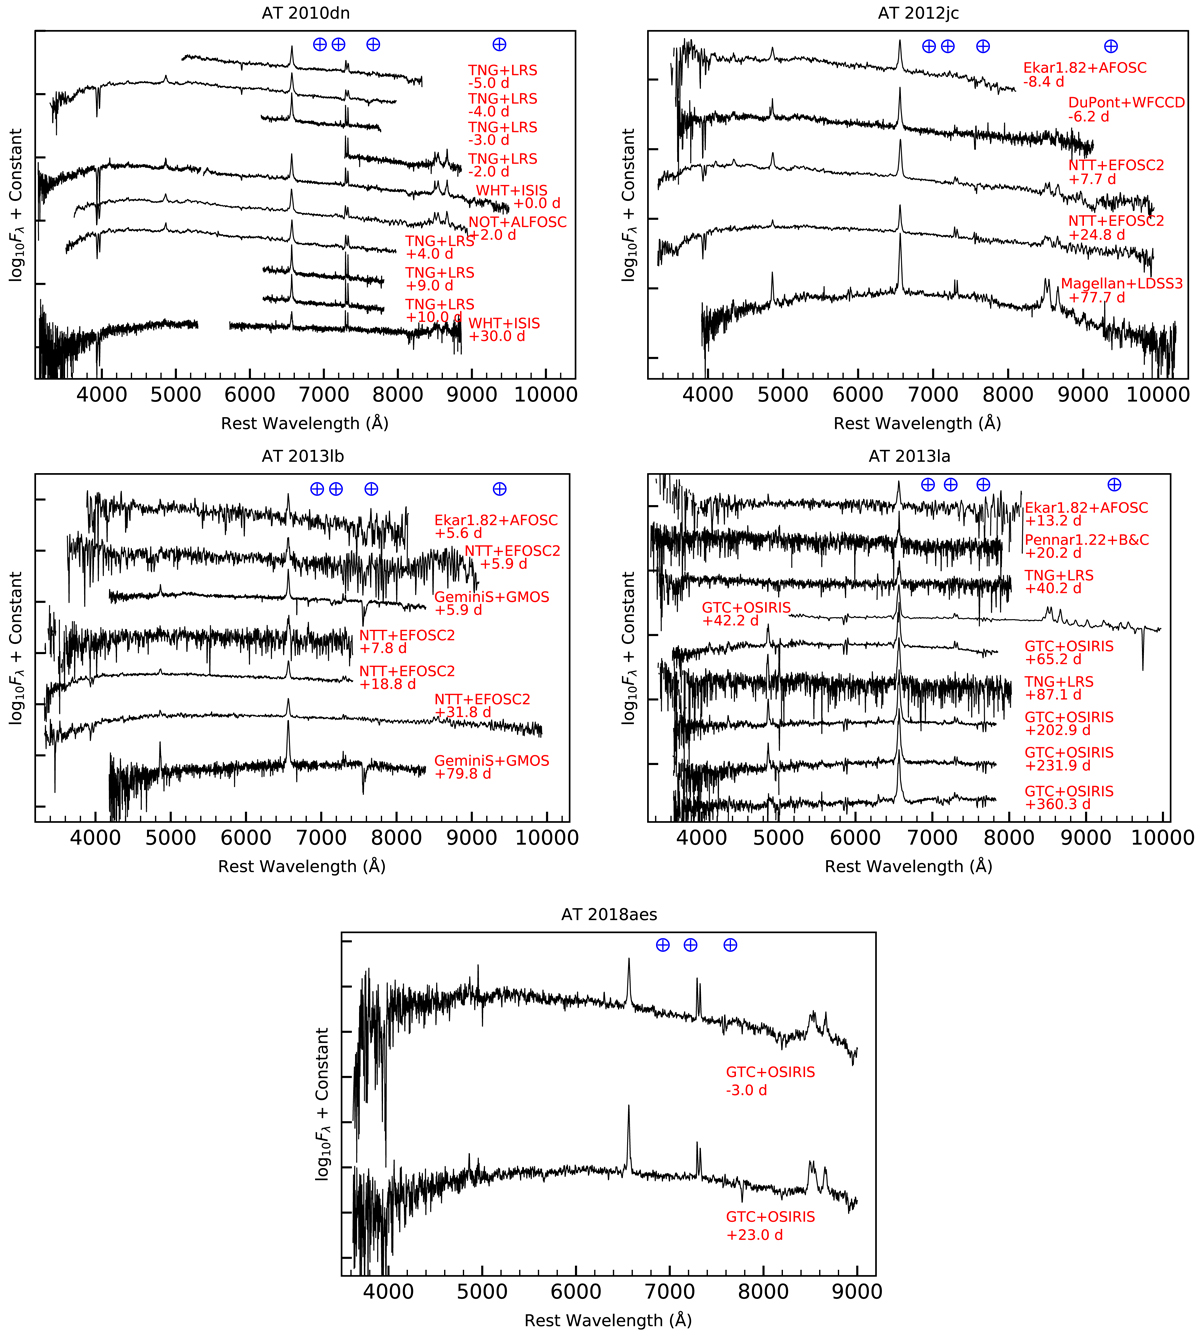
Download original image
Spectral evolution of AT 2010dn (top-left), AT 2012jc (top-right), AT 2013lb (middle-left), AT 2013la (middle-right), and AT 2018aes (bottom). The epochs marked to the right of each spectrum are relative to the R/r-band maximum. The ⨁ symbols mark the position of the strongest telluric absorption bands. The spectra are only corrected for redshift.
Current usage metrics show cumulative count of Article Views (full-text article views including HTML views, PDF and ePub downloads, according to the available data) and Abstracts Views on Vision4Press platform.
Data correspond to usage on the plateform after 2015. The current usage metrics is available 48-96 hours after online publication and is updated daily on week days.
Initial download of the metrics may take a while.