Fig. 4.
Download original image
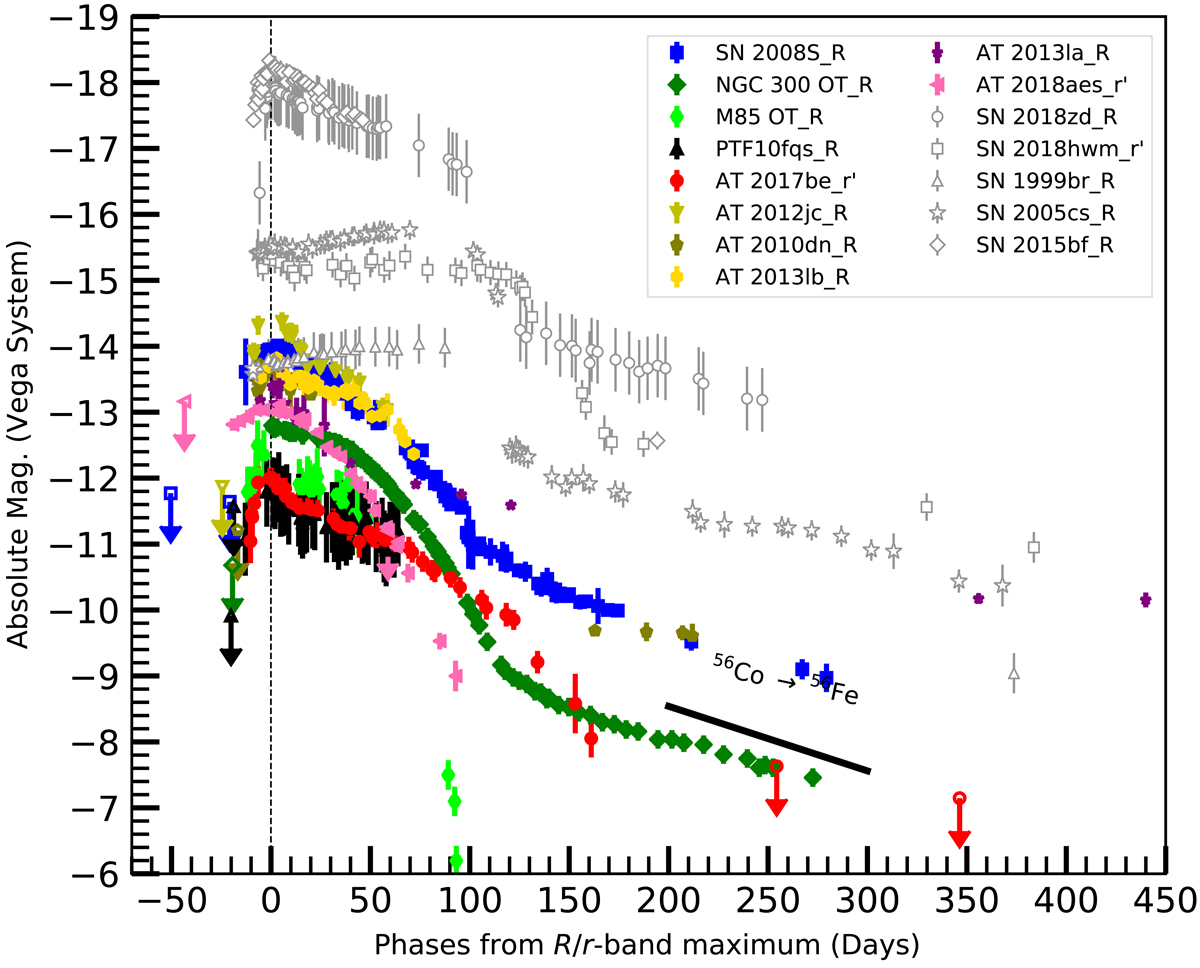
Comparison of the R/r-band absolute light curves of ILRTs and SN 2018zd, SN 2018hwm, SN 1999br, and SN 2005cs. Reddenings and distance moduli of the comparison objects are taken from their respective papers (also see Table B.1). The dashed vertical line indicates the time of r-band maximum light. Upper limits are marked by empty symbols with down arrows.
Current usage metrics show cumulative count of Article Views (full-text article views including HTML views, PDF and ePub downloads, according to the available data) and Abstracts Views on Vision4Press platform.
Data correspond to usage on the plateform after 2015. The current usage metrics is available 48-96 hours after online publication and is updated daily on week days.
Initial download of the metrics may take a while.