Fig. 3.
Download original image
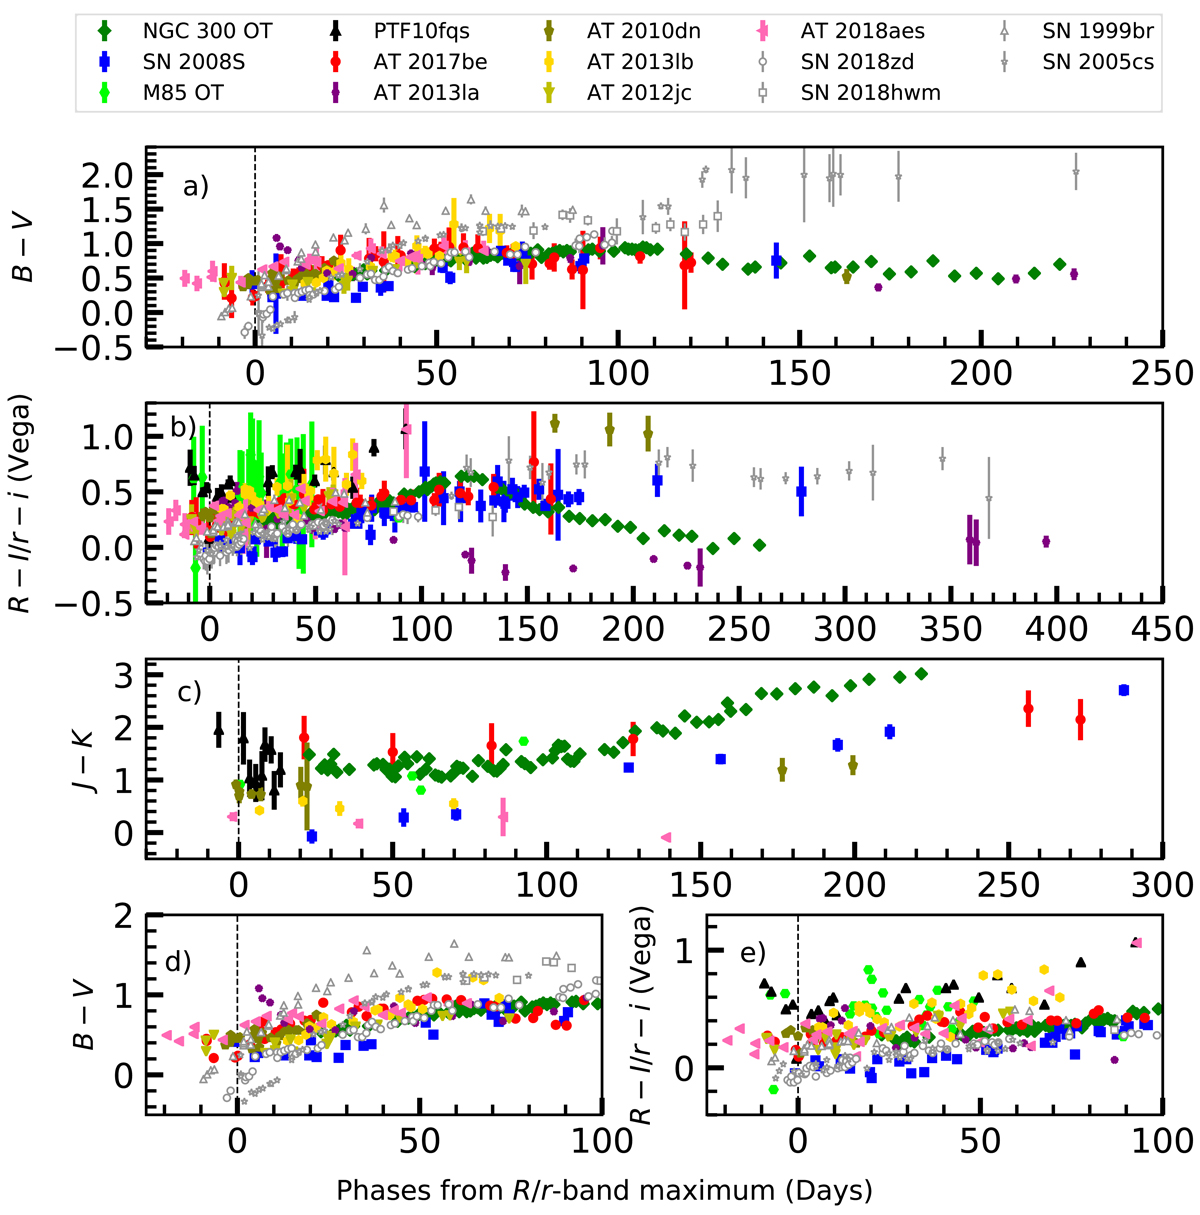
Colour evolution of ILRTs, along with those of the comparison objects: SN 2018zd (Zhang et al. 2020), SN 2018hwm (Reguitti et al. 2021), SN 1999br (Pastorello et al. 2004), and SN 2005cs (Pastorello et al. 2006, 2009). (a) B − V colour curves of ILRTs; (b) R − I/r − i colour curves; (c) J − K colour curves; (d) and (e) show the same colours as panels a and b until +100 days without error bars for clarity. All phases are with respect to the R/r-band maximum.
Current usage metrics show cumulative count of Article Views (full-text article views including HTML views, PDF and ePub downloads, according to the available data) and Abstracts Views on Vision4Press platform.
Data correspond to usage on the plateform after 2015. The current usage metrics is available 48-96 hours after online publication and is updated daily on week days.
Initial download of the metrics may take a while.