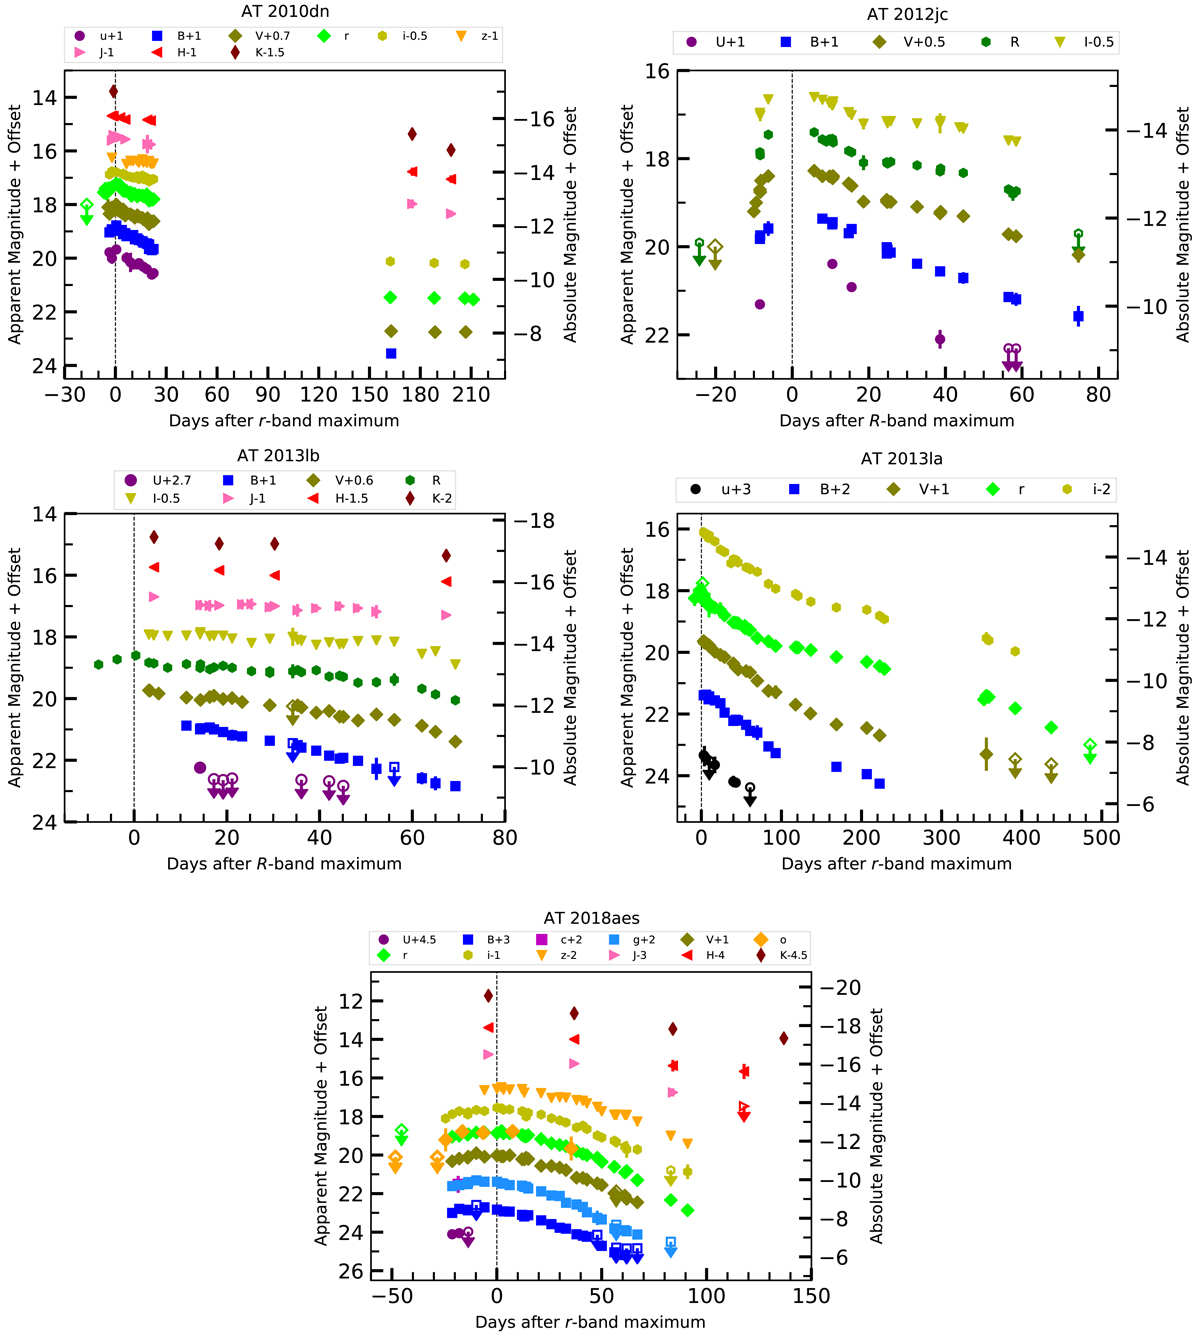
Fig. 2.
Download original image
Multi-band light curves of AT 2010dn (top-left), AT 2012jc (top-right), AT 2013lb (middle-left), AT 2013la (middle-right), and AT 2018aes (bottom). The dashed vertical lines indicate the R/r-band maximum time. Upper limits are marked by empty symbols with arrows. The light curves are shifted with some constants for clarity and the shift amount is reported at the top. The errors of most magnitudes are smaller than the plotted symbol sizes.
Current usage metrics show cumulative count of Article Views (full-text article views including HTML views, PDF and ePub downloads, according to the available data) and Abstracts Views on Vision4Press platform.
Data correspond to usage on the plateform after 2015. The current usage metrics is available 48-96 hours after online publication and is updated daily on week days.
Initial download of the metrics may take a while.