Free Access
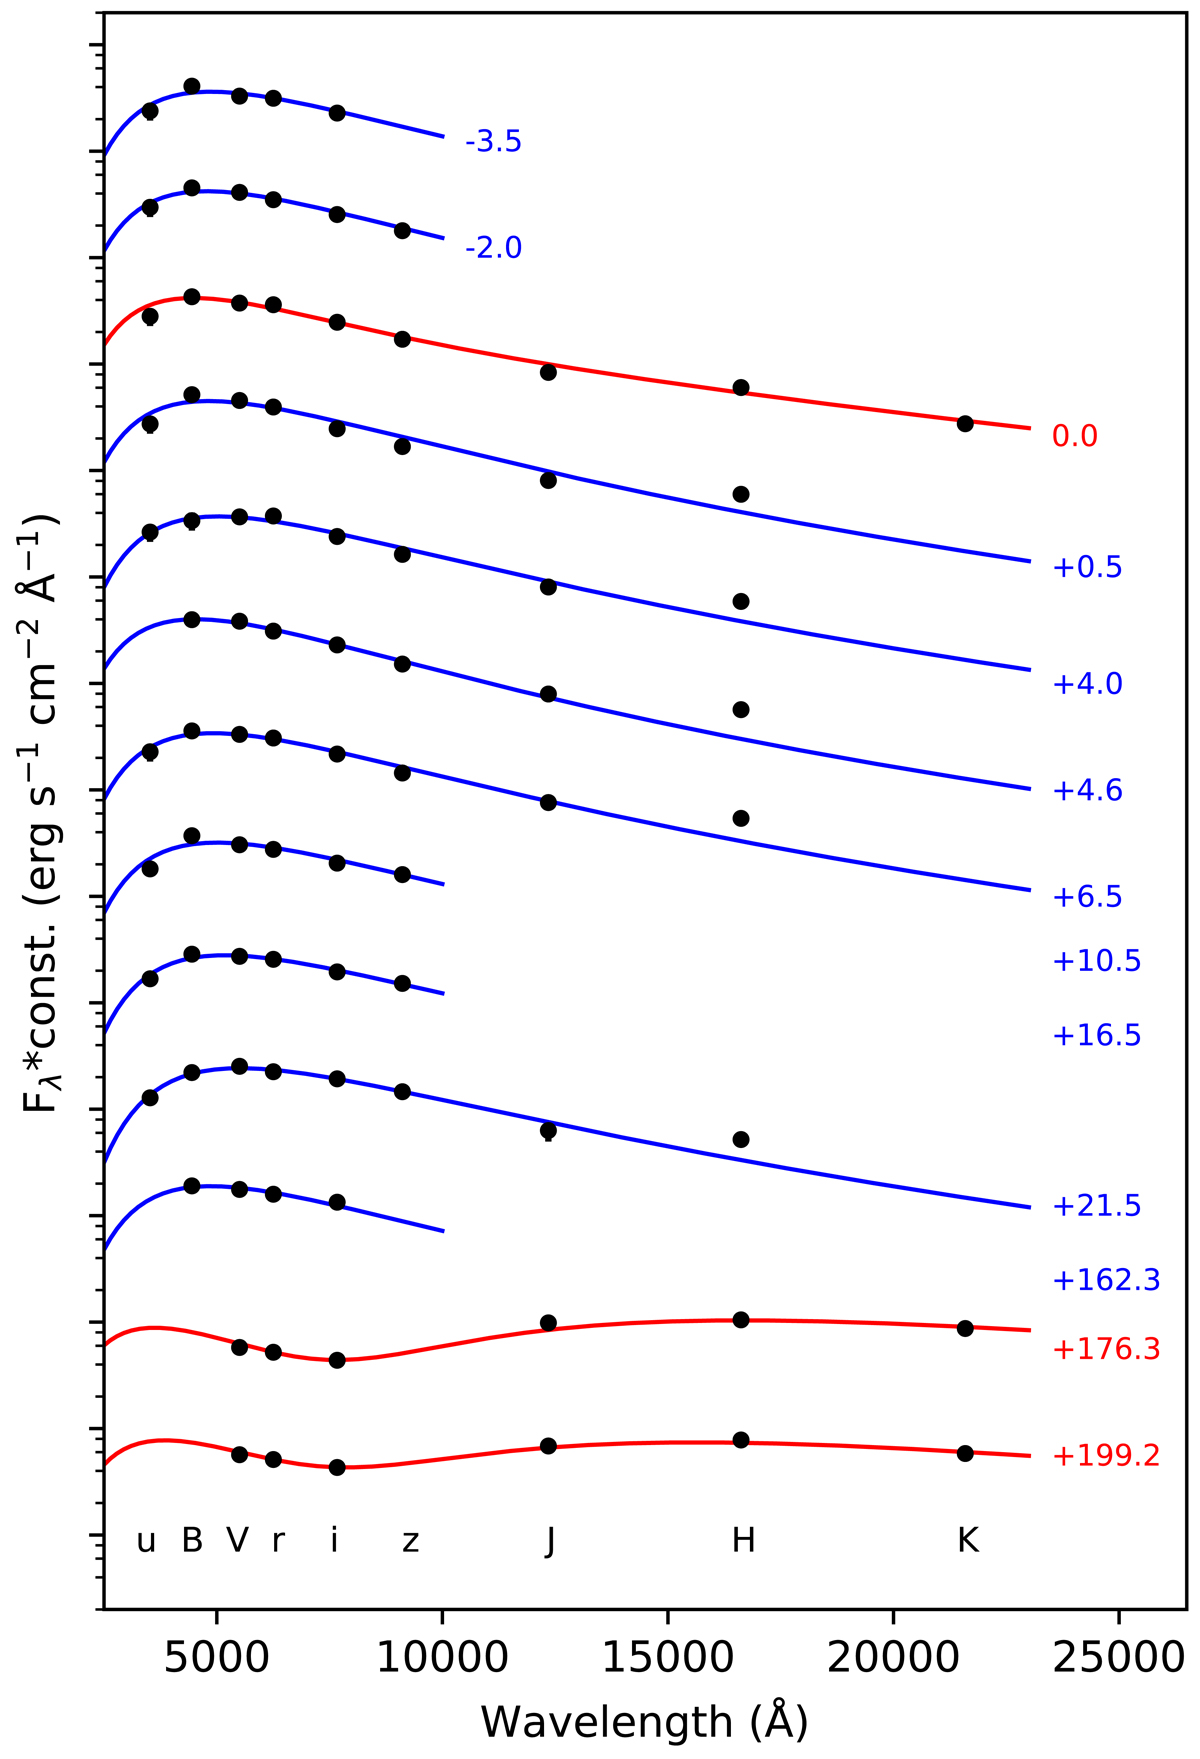
Fig. C.1.
Download original image
SED evolution of AT 2010dn. The lines are the best-fit BBs, which are overplotted on each SED. Blue lines are the fits of the single BB, while red lines are the fits of the double BB. The epochs marked to the right of each SED are relative to the r-band maximum. Each SED has been sifted by an arbitrary constant for clarity.
Current usage metrics show cumulative count of Article Views (full-text article views including HTML views, PDF and ePub downloads, according to the available data) and Abstracts Views on Vision4Press platform.
Data correspond to usage on the plateform after 2015. The current usage metrics is available 48-96 hours after online publication and is updated daily on week days.
Initial download of the metrics may take a while.