Free Access
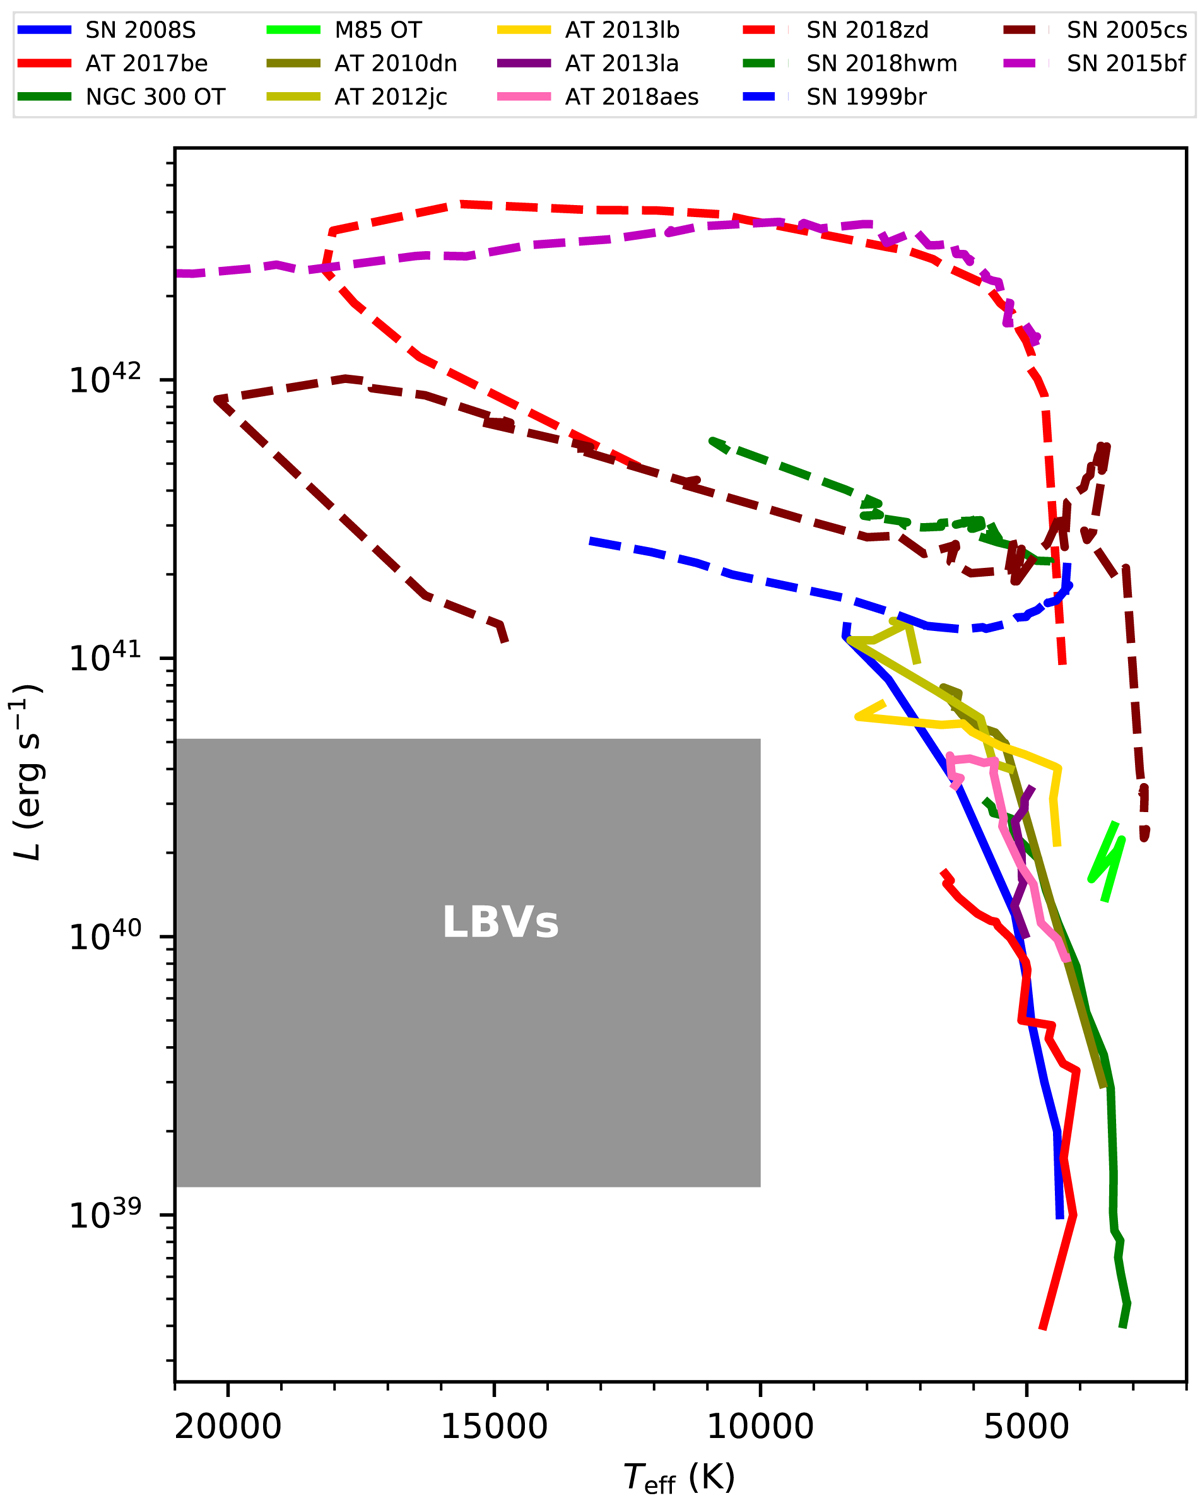
Fig. 16.
Download original image
Luminosity (L) vs. effective temperature (Teff). ILRTs are marked as solid lines with different colours, while the area where LBVs lie is marked in grey. Comparison SNe II lie in the upper part of the diagram and are labelled with dashed lines.
Current usage metrics show cumulative count of Article Views (full-text article views including HTML views, PDF and ePub downloads, according to the available data) and Abstracts Views on Vision4Press platform.
Data correspond to usage on the plateform after 2015. The current usage metrics is available 48-96 hours after online publication and is updated daily on week days.
Initial download of the metrics may take a while.