Fig. 13.
Download original image
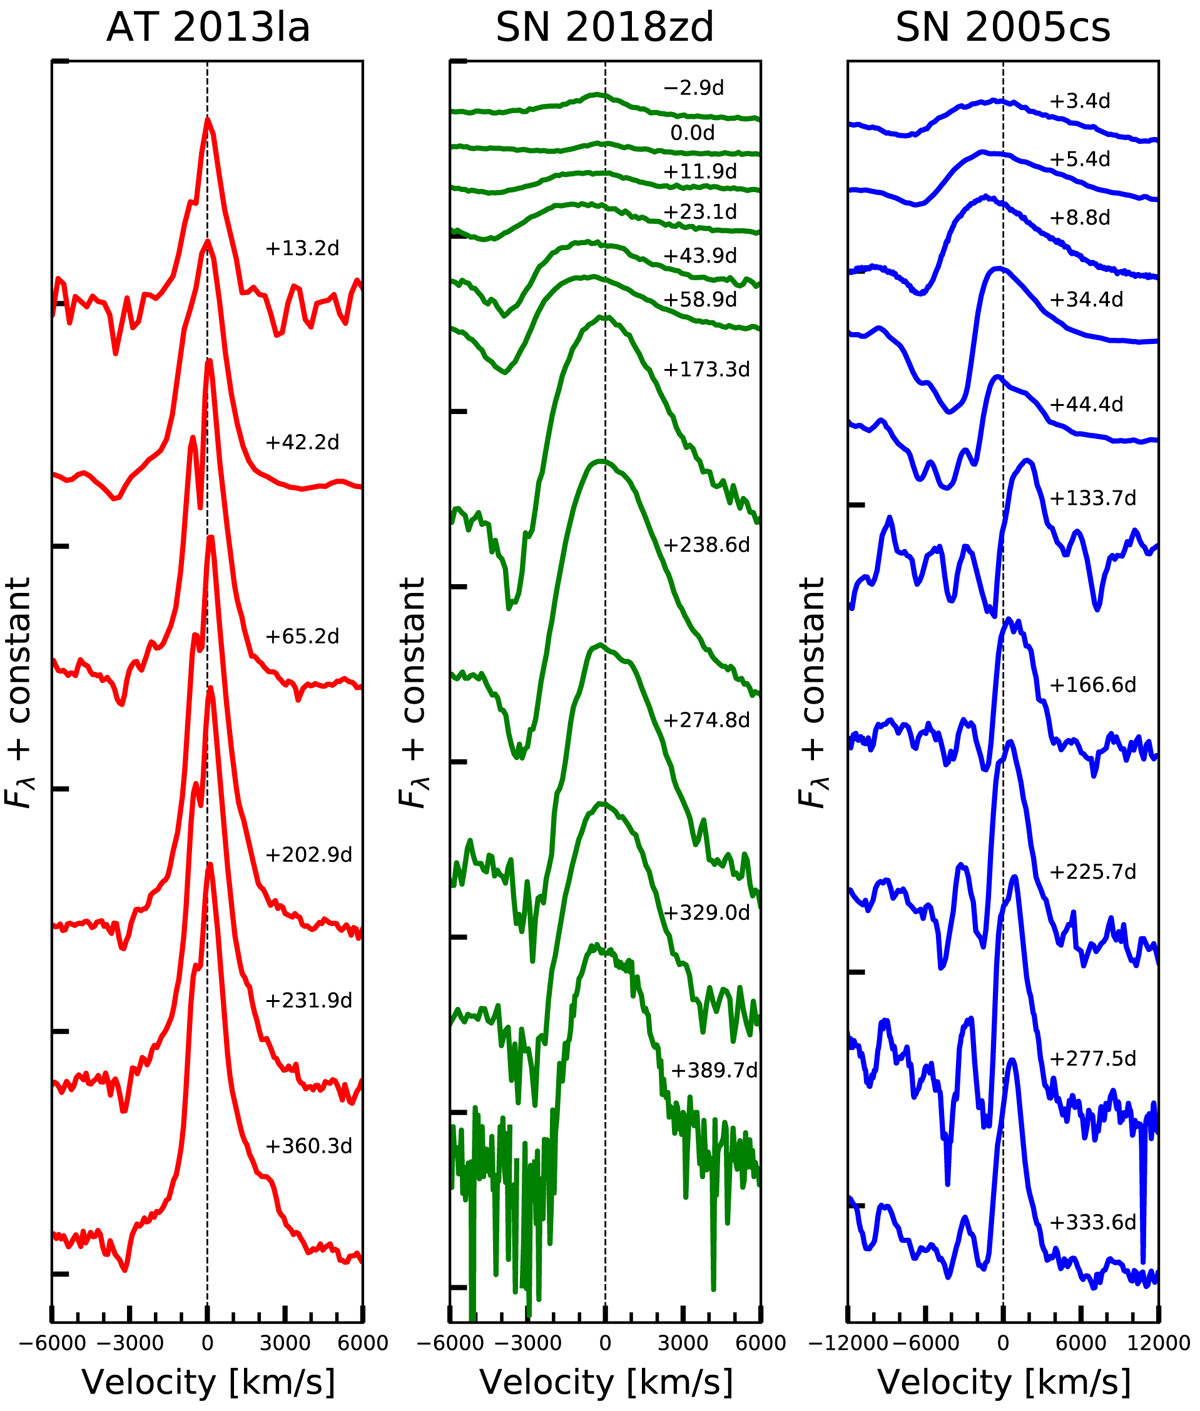
Evolution of the Hα profile in selected spectra of the ILRT AT 2013la (left panel), SN 2018zd (Zhang et al. 2020, middle panel), and the underluminous Type IIP SN 2005cs (Pastorello et al. 2006, 2009, right panel). The Hα lines are shown in the velocity space, with zero velocity (rest wavelength) being marked by a grey dashed line.
Current usage metrics show cumulative count of Article Views (full-text article views including HTML views, PDF and ePub downloads, according to the available data) and Abstracts Views on Vision4Press platform.
Data correspond to usage on the plateform after 2015. The current usage metrics is available 48-96 hours after online publication and is updated daily on week days.
Initial download of the metrics may take a while.