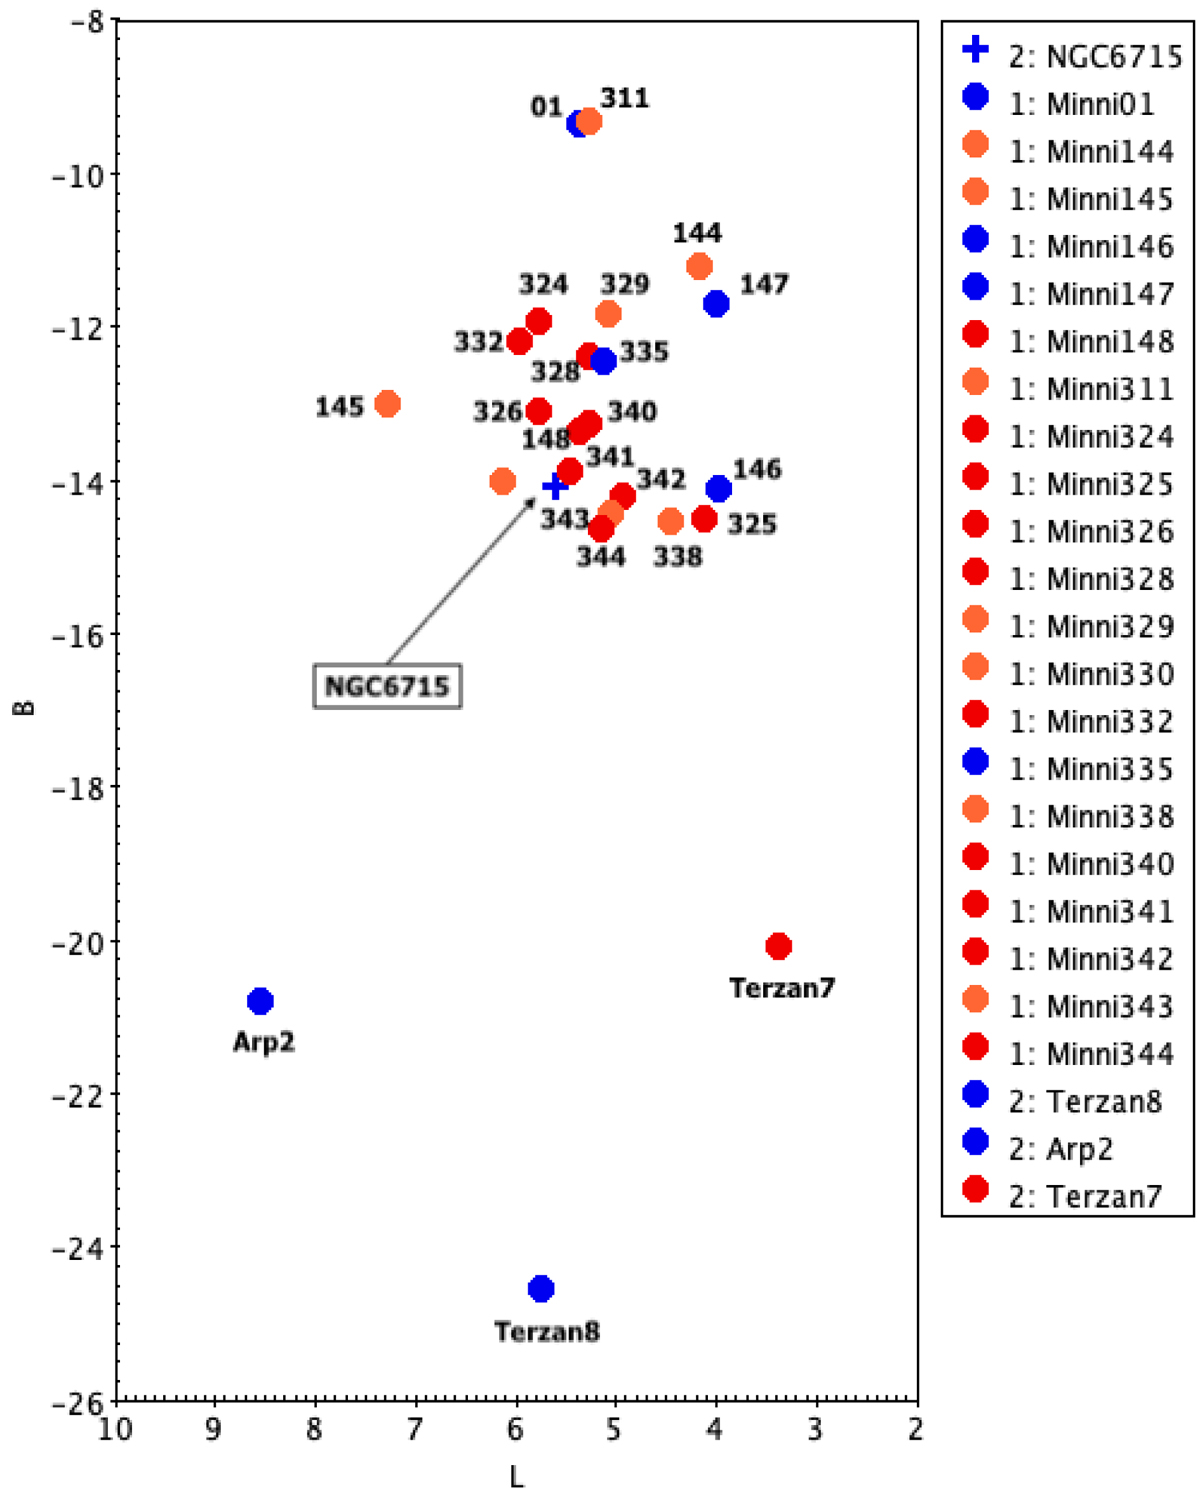
Fig. 2.
Download original image
Latitude vs. longitude map depicting the position of Sgr GCs in the main body. The colored points highlight the cluster metallicity. Red shows GCs with [Fe/H] ≥ − 0.5, orange shows GCs with −1.0 ≤ [Fe/H] ≤ − 0.6, and blue shows GCs with [Fe/H] ≤ − 1.1 for our convention. We included NGC 6715, Terzan 7, Terzan 8, and Arp 2 for comparison.
Current usage metrics show cumulative count of Article Views (full-text article views including HTML views, PDF and ePub downloads, according to the available data) and Abstracts Views on Vision4Press platform.
Data correspond to usage on the plateform after 2015. The current usage metrics is available 48-96 hours after online publication and is updated daily on week days.
Initial download of the metrics may take a while.