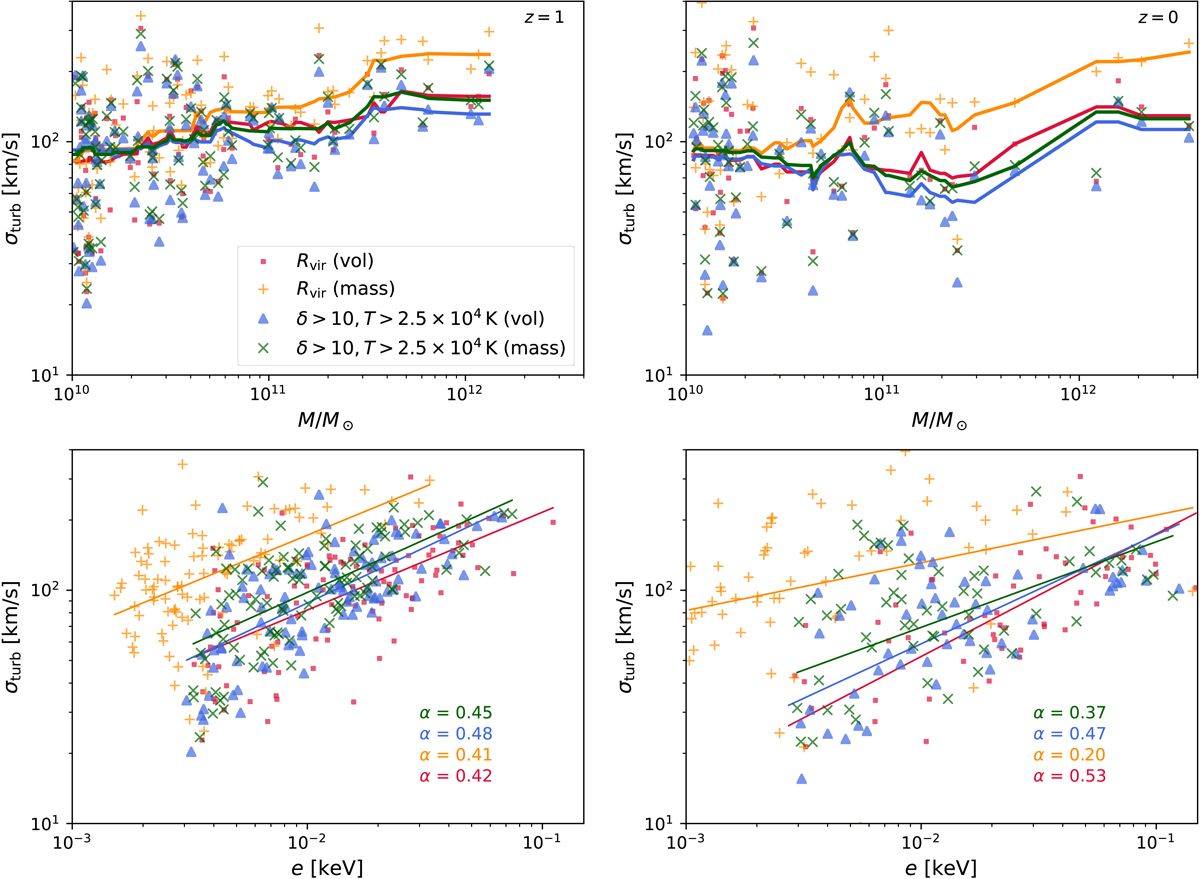
Fig. 11.
Download original image
Mean values of the turbulent velocity dispersion vs. halo mass (top) and mean thermal energy (bottom) for halos at redshift z = 1 (left) and z = 0 (right). As indicated in the legend, both volume- and mass-weighted averages are computed for cells within the virial radius or cells with density and temperature above the specified thresholds. While the thick solid lines in the top plots (σturb vs. M) are sliding medians as Fig. 9, the lower plots (σturb vs. e) show power-law fits with slope α.
Current usage metrics show cumulative count of Article Views (full-text article views including HTML views, PDF and ePub downloads, according to the available data) and Abstracts Views on Vision4Press platform.
Data correspond to usage on the plateform after 2015. The current usage metrics is available 48-96 hours after online publication and is updated daily on week days.
Initial download of the metrics may take a while.