Fig. 3
Download original image
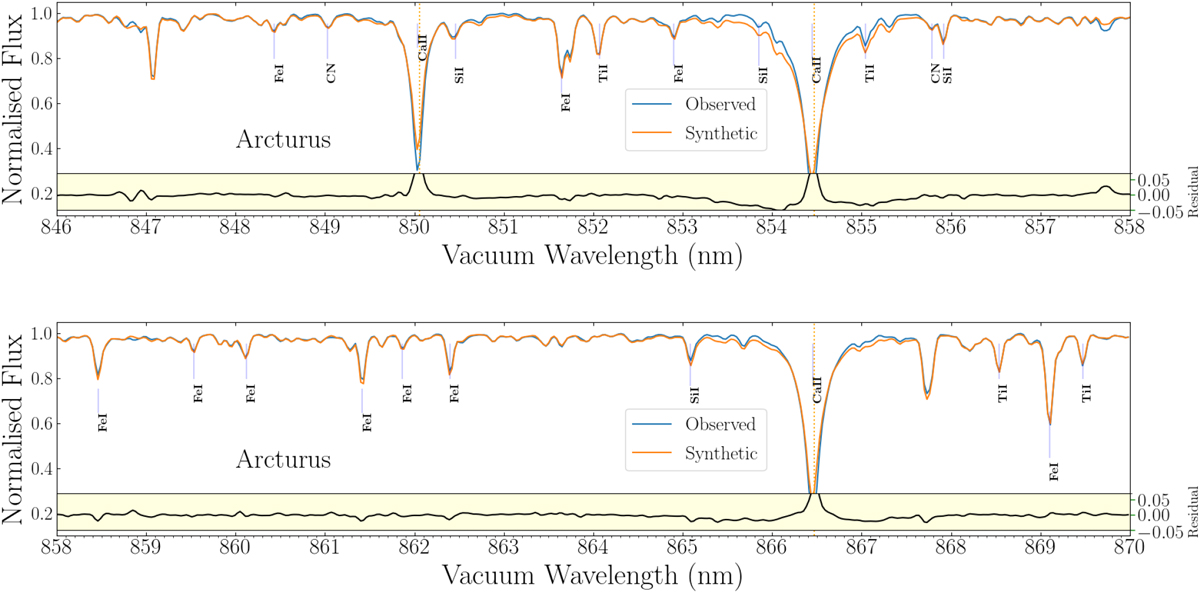
Observed (blue) and synthetic (orange) spectra for Arcturus. Vertical green and orange dashed lines identify spectral lines differing by between 3 and 5% and by more than 5% in relative flux, respectively. These spectra were computed adopting the final GSP-Spec line list and are shown at the RVS spectral resolution with 800 wlp. We note that the wavelengths are shown in vacuum. Some line identifications are shown for non-blended absorption lines with a normalised flux below 0.93. The lower yellow insets show the difference between the observed and synthetic fluxes.
Current usage metrics show cumulative count of Article Views (full-text article views including HTML views, PDF and ePub downloads, according to the available data) and Abstracts Views on Vision4Press platform.
Data correspond to usage on the plateform after 2015. The current usage metrics is available 48-96 hours after online publication and is updated daily on week days.
Initial download of the metrics may take a while.