Fig. 9
Download original image
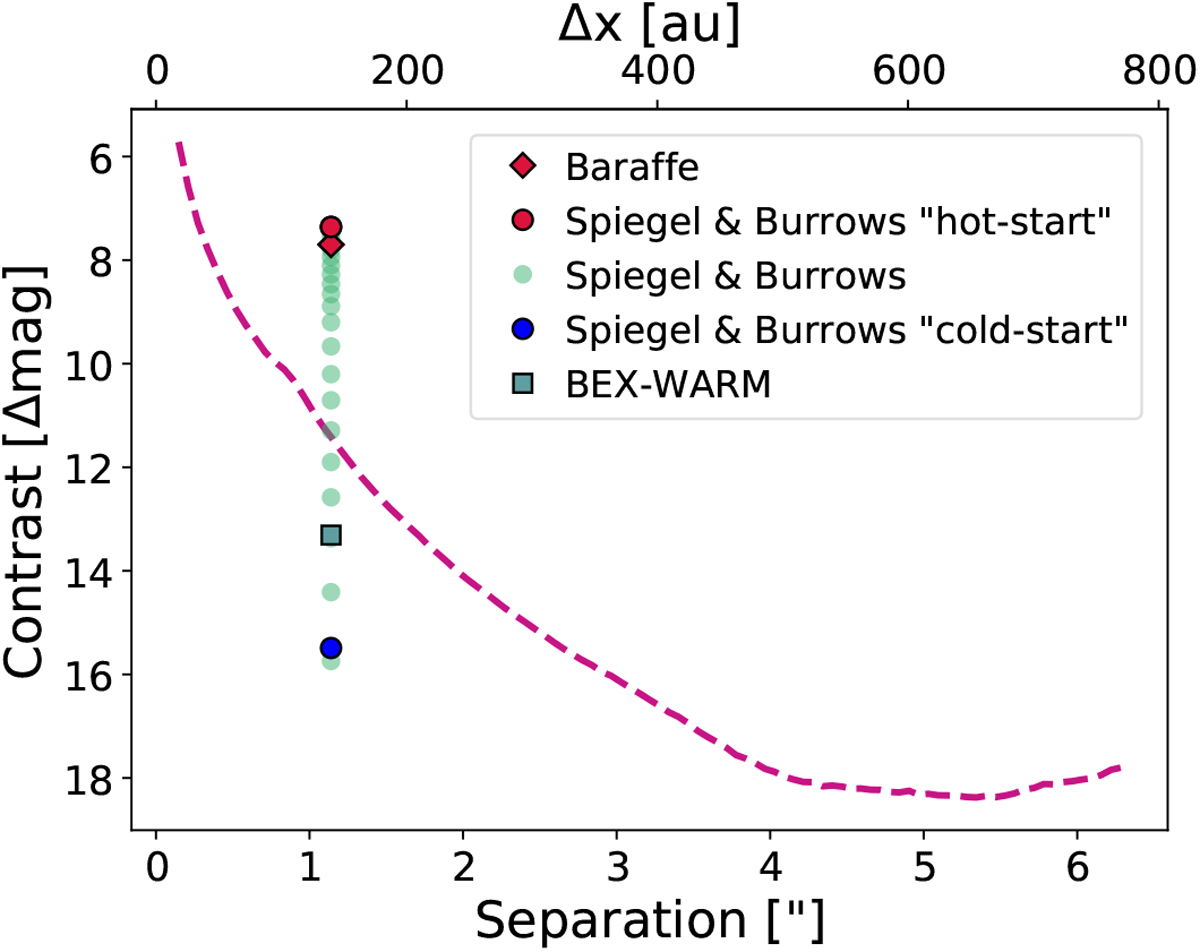
Planet detection limits as a function of the separation from the star for the SPHERE H-band. The purple curve is the 3σ contrast obtained from the total intensity SPHERE image of WaOph 6. The markers show the magnitude contrast of the proposed 10 MJup planet at 140 au estimated from different evolutionary models. The red markers show the resulting contrast for the “hot-start” scenario from the Baraffe et al. (2003) (red diamond) and Spiegel & Burrows (2012) (red dot) models, while the blue dot shows the contrast for a “cold-start” from the Spiegel & Burrows (2012) models. The green square shows the contrastfrom the BEX-WARM models (see text). And the green dots show the contrast for different initial entropy values from the Spiegel & Burrows (2012) models.
Current usage metrics show cumulative count of Article Views (full-text article views including HTML views, PDF and ePub downloads, according to the available data) and Abstracts Views on Vision4Press platform.
Data correspond to usage on the plateform after 2015. The current usage metrics is available 48-96 hours after online publication and is updated daily on week days.
Initial download of the metrics may take a while.