Fig. 2
Download original image
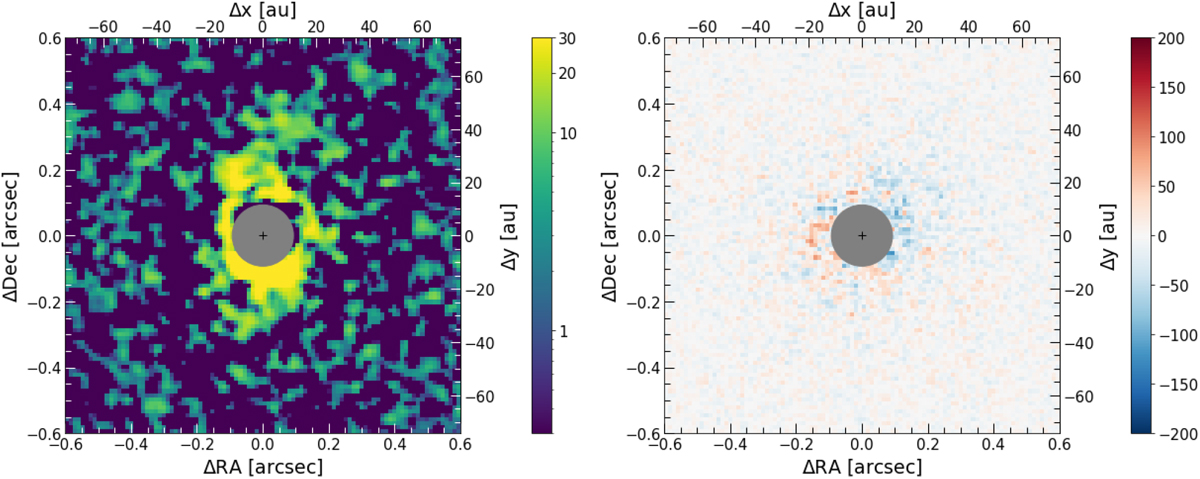
Left: close up of the final Qϕ SPHERE/IRDIS-DPI image after removing low frequency structures (see text for details) and applying a Gaussian kernel of size 0.1 × FWHM to smooth the images and enhance the spiral features. Right: close up of the final Uϕ image showing the positive and negative signal. The 93 mas coronagraph is indicated by the gray circle, and the cross indicates the position of the star. The flux is normalized to the maximum value in the Qϕ image.
Current usage metrics show cumulative count of Article Views (full-text article views including HTML views, PDF and ePub downloads, according to the available data) and Abstracts Views on Vision4Press platform.
Data correspond to usage on the plateform after 2015. The current usage metrics is available 48-96 hours after online publication and is updated daily on week days.
Initial download of the metrics may take a while.