Free Access
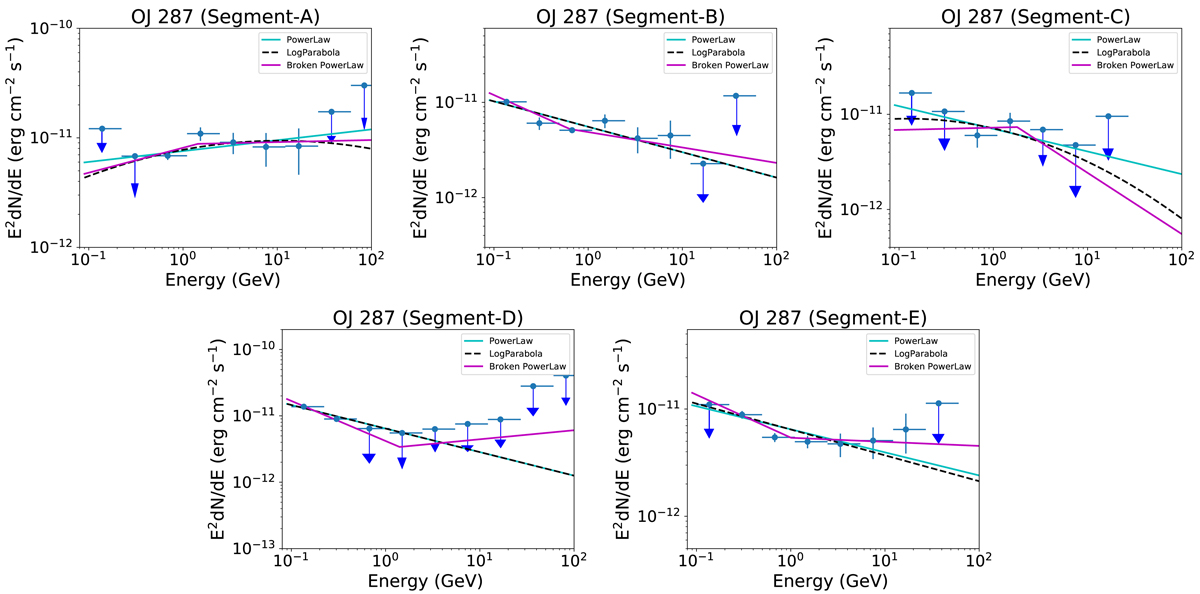
Fig. 3.
Download original image
Gamma-ray SED of all the segments identified during 2017–2020 in OJ 287 modeled with three different spectral models: PL, LP, and BPL (see Sect. 3.2 for more details). The down arrow represents the upper limit in that particular segment.
Current usage metrics show cumulative count of Article Views (full-text article views including HTML views, PDF and ePub downloads, according to the available data) and Abstracts Views on Vision4Press platform.
Data correspond to usage on the plateform after 2015. The current usage metrics is available 48-96 hours after online publication and is updated daily on week days.
Initial download of the metrics may take a while.