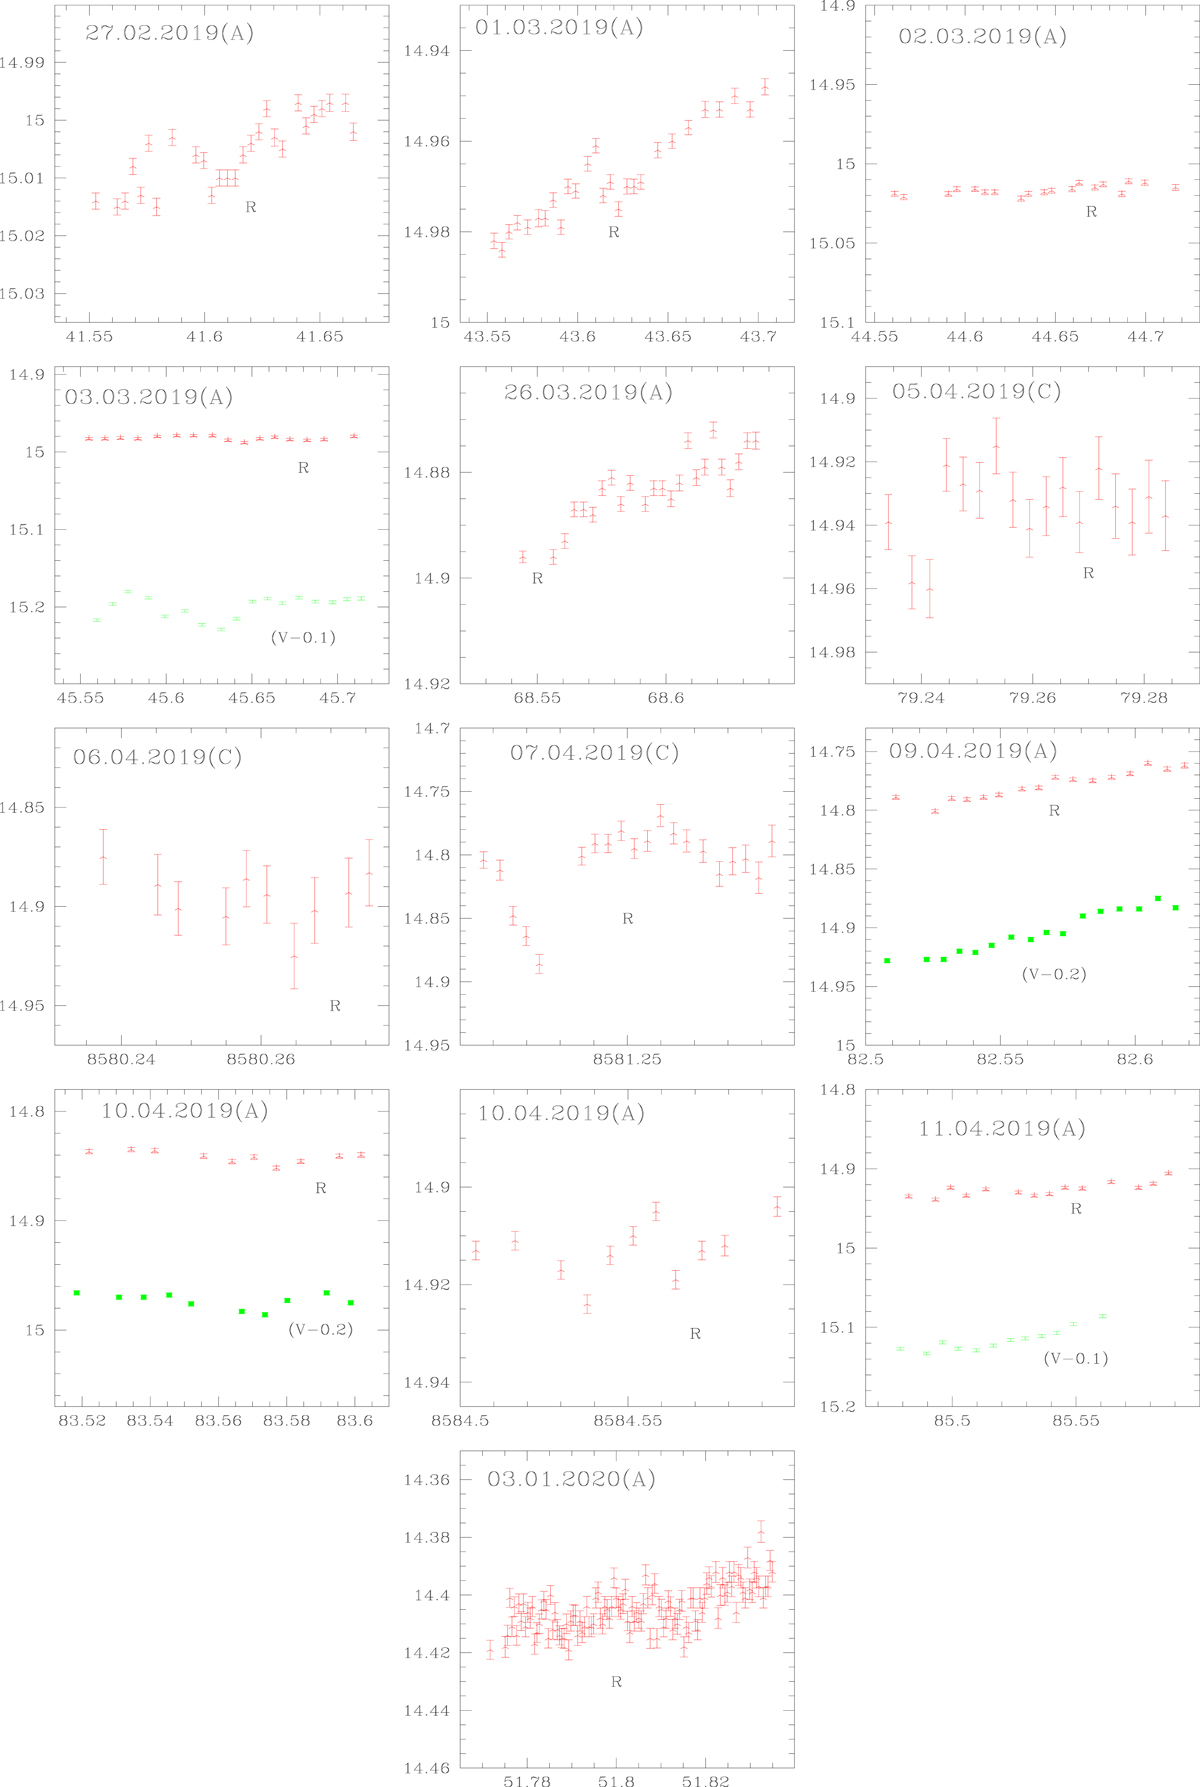
Fig. 2.
Download original image
Light curves for OJ 287; green denotes V band while red denotes R filter. In each plot the X-axis is JD and the Y axis is the source magnitude. Observation date and the telescope used are indicated in each plot. Telescope A, is JS (2.15 m Jorge Sahade telescope), telescope B is HSH (Helen Sawyer Hogg telescope), and telescope C is JCBT (Vainu Bappu Observatory, India).
Current usage metrics show cumulative count of Article Views (full-text article views including HTML views, PDF and ePub downloads, according to the available data) and Abstracts Views on Vision4Press platform.
Data correspond to usage on the plateform after 2015. The current usage metrics is available 48-96 hours after online publication and is updated daily on week days.
Initial download of the metrics may take a while.