Fig. 7.
Download original image
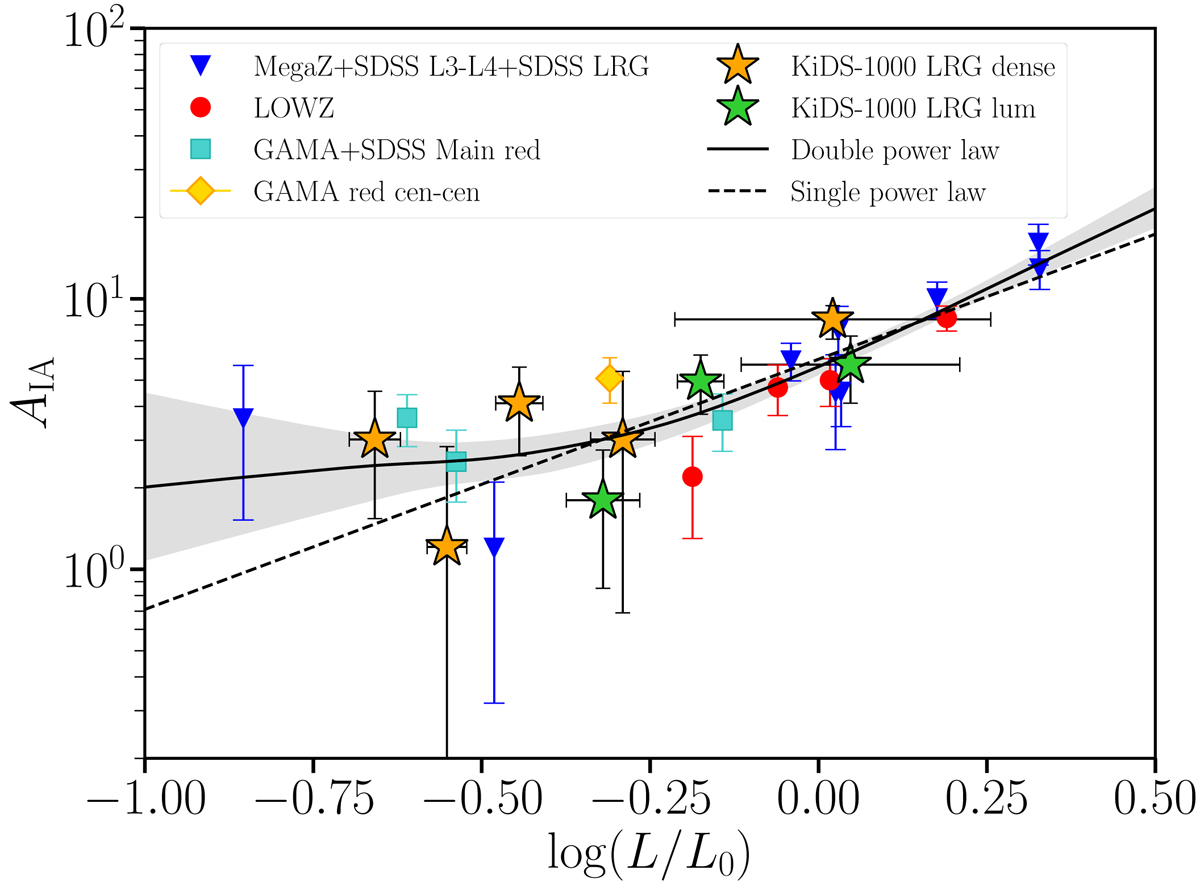
Luminosity dependence of the IA amplitude as measured by different observational studies (Joachimi et al. 2011; Singh et al. 2015; Johnston et al. 2019; Fortuna et al. 2021); our new measurements on the LRG samples are shown as star markers. We provide horizontal error bars to indicate that the measurement is performed on a bin in luminosity, here plotted as the weighted standard deviation of the luminosity distribution of each sample, with the marker placed at the weighted mean. The solid (dashed) black line shows the median of the distribution of the MCMC sample associated with the double (single) power law; the shaded area corresponds to the 68% confidence region.
Current usage metrics show cumulative count of Article Views (full-text article views including HTML views, PDF and ePub downloads, according to the available data) and Abstracts Views on Vision4Press platform.
Data correspond to usage on the plateform after 2015. The current usage metrics is available 48-96 hours after online publication and is updated daily on week days.
Initial download of the metrics may take a while.