Fig. 5.
Download original image
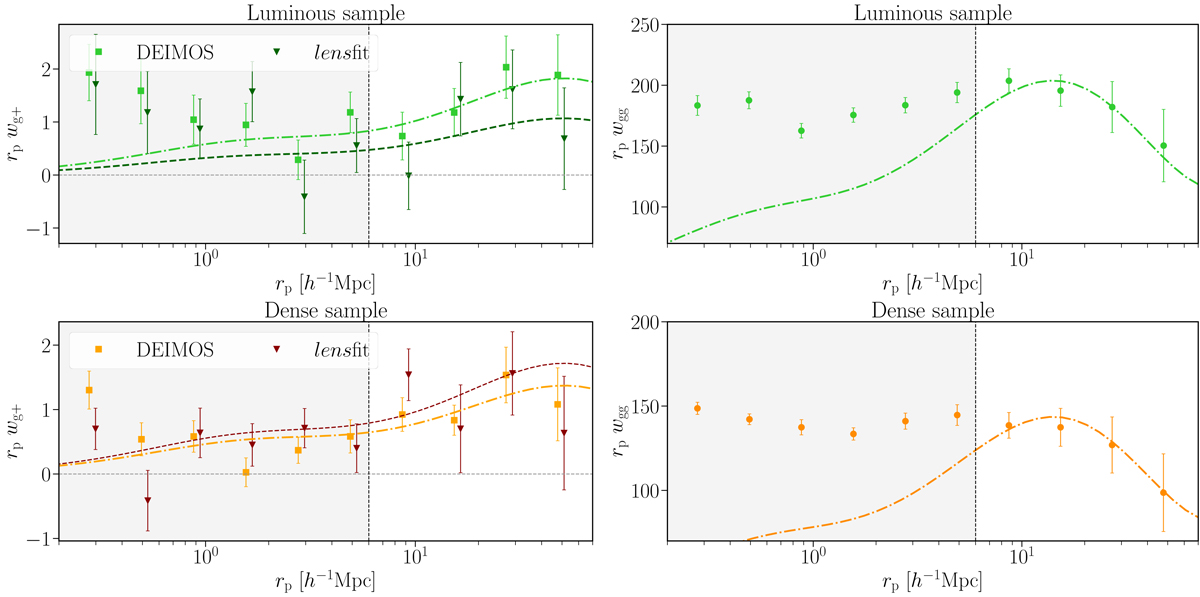
Projected correlation functions (IA and clustering signal) measured in this work and the best-fit curve predicted by our model. Left: projected position-shape correlation function, wg+, measured for our luminous (top panel) and dense (bottom panel) samples. We show results for shapes measured with DEIMOS (light squares) and lensfit (dark triangles). The best-fit models to the data with rp > 6 h−1 Mpc (indicated by the vertical dashed line), are shown as well, with the same colour scheme (DEIMOS: dash-dotted lines, lensfit: dashed lines). For clarity, the lensfit results have been slightly offset horizontally. Right: projected clustering signal, wgg, of the dense and luminous samples. The dot-dashed lines corresponds to the best-fit models. As we do not include a scale-dependent bias in our model, the mismatch between data and prediction at small scales is expected.
Current usage metrics show cumulative count of Article Views (full-text article views including HTML views, PDF and ePub downloads, according to the available data) and Abstracts Views on Vision4Press platform.
Data correspond to usage on the plateform after 2015. The current usage metrics is available 48-96 hours after online publication and is updated daily on week days.
Initial download of the metrics may take a while.