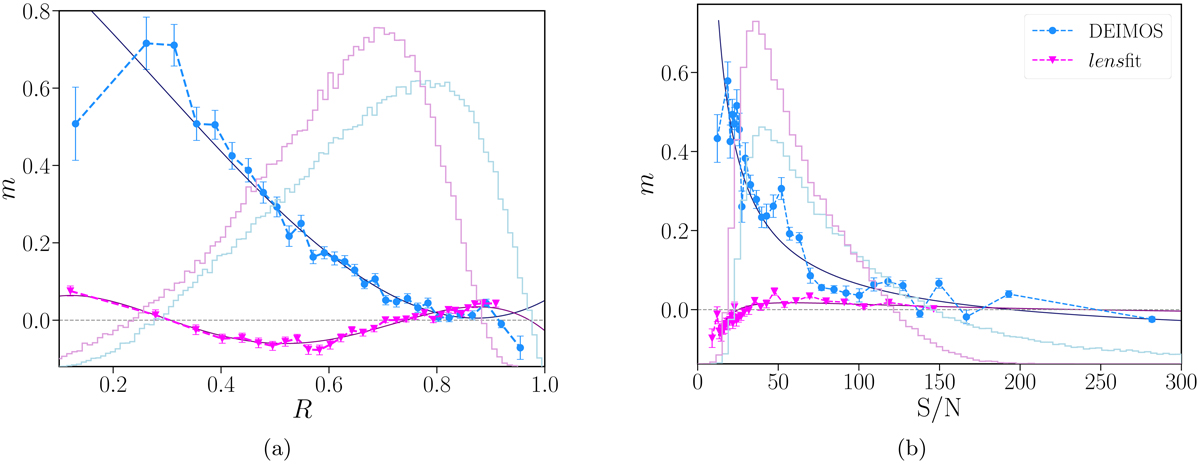
Fig. 3.
Download original image
Average multiplicative bias, m = (mϵ1 + mϵ2)/2, as a function of (a) the galaxy resolution, R, and (b) the signal-to-noise ratio, S/N. Each point is measured on the same number of simulated galaxies and the error bars are estimated using bootstraps. For a comparison we also display in the background the weighted distribution of the two definitions of R and the S/N in the real data for the dense shape samples (pink: lensfit; blue: DEIMOS). The solid lines show the polynomial fit to m(R) and m(S/N), which guided the construction of the two-dimensional bias surface.
Current usage metrics show cumulative count of Article Views (full-text article views including HTML views, PDF and ePub downloads, according to the available data) and Abstracts Views on Vision4Press platform.
Data correspond to usage on the plateform after 2015. The current usage metrics is available 48-96 hours after online publication and is updated daily on week days.
Initial download of the metrics may take a while.