Fig. 8.
Download original image
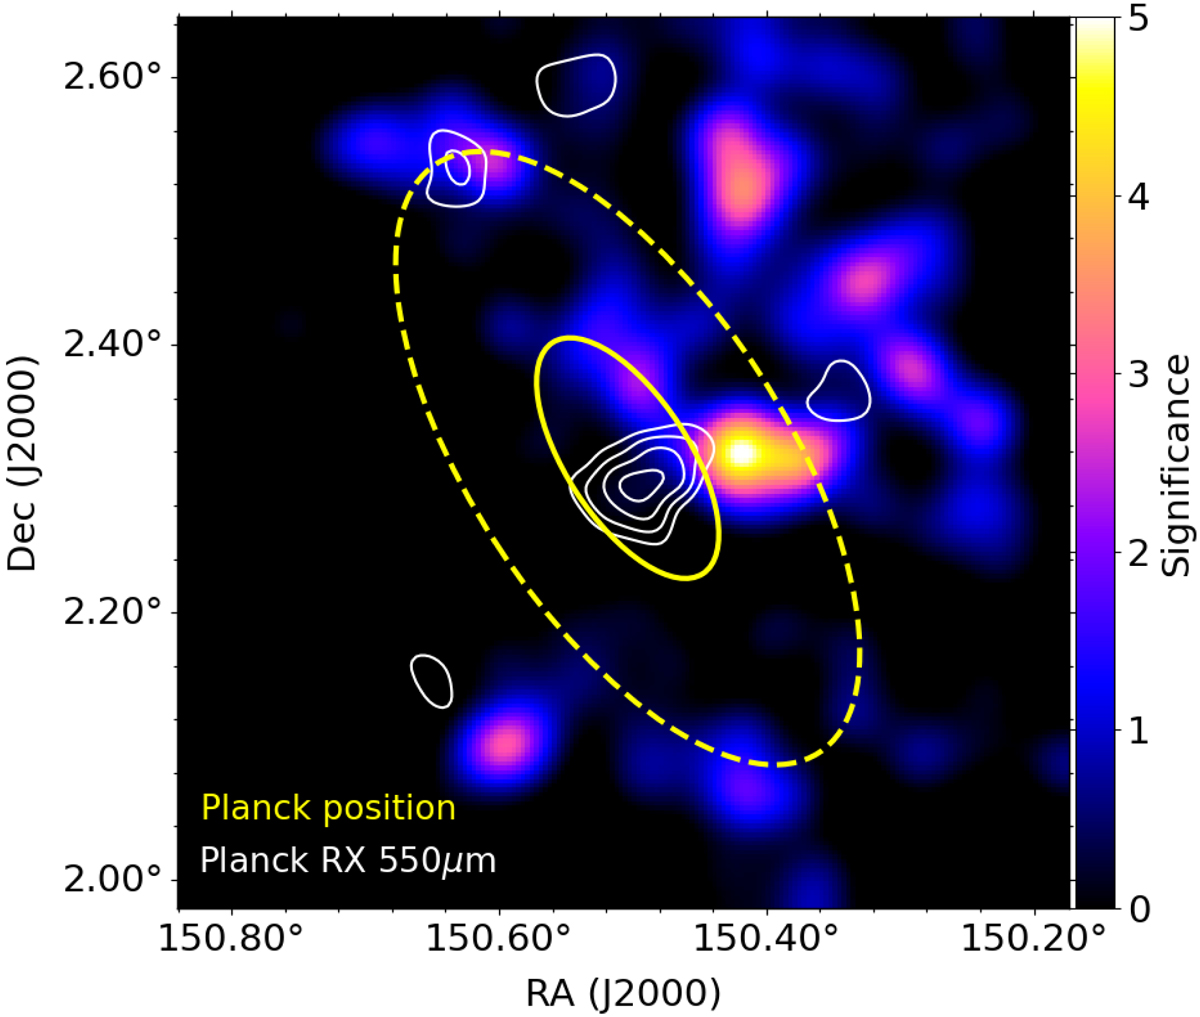
40′ × 40′ map centered on G237 showing the significance of the flux-weighted density contrast of the red SPIRE sources based on the distance distribution to the 10th nearest neighbors. White contours represent the Planck signal in the 550 μm red-excess map at 50, 62.5, 75, and 87.5% of the peak value. The yellow ellipse represents the double Gaussian fit (solid: full axis equal to FWHM, dashed: half axis equal to 3σpos) obtained when measuring the position and extent of G237 in the Planck maps. The map and the contours have been smoothed with a 3′ Gaussian filter.
Current usage metrics show cumulative count of Article Views (full-text article views including HTML views, PDF and ePub downloads, according to the available data) and Abstracts Views on Vision4Press platform.
Data correspond to usage on the plateform after 2015. The current usage metrics is available 48-96 hours after online publication and is updated daily on week days.
Initial download of the metrics may take a while.