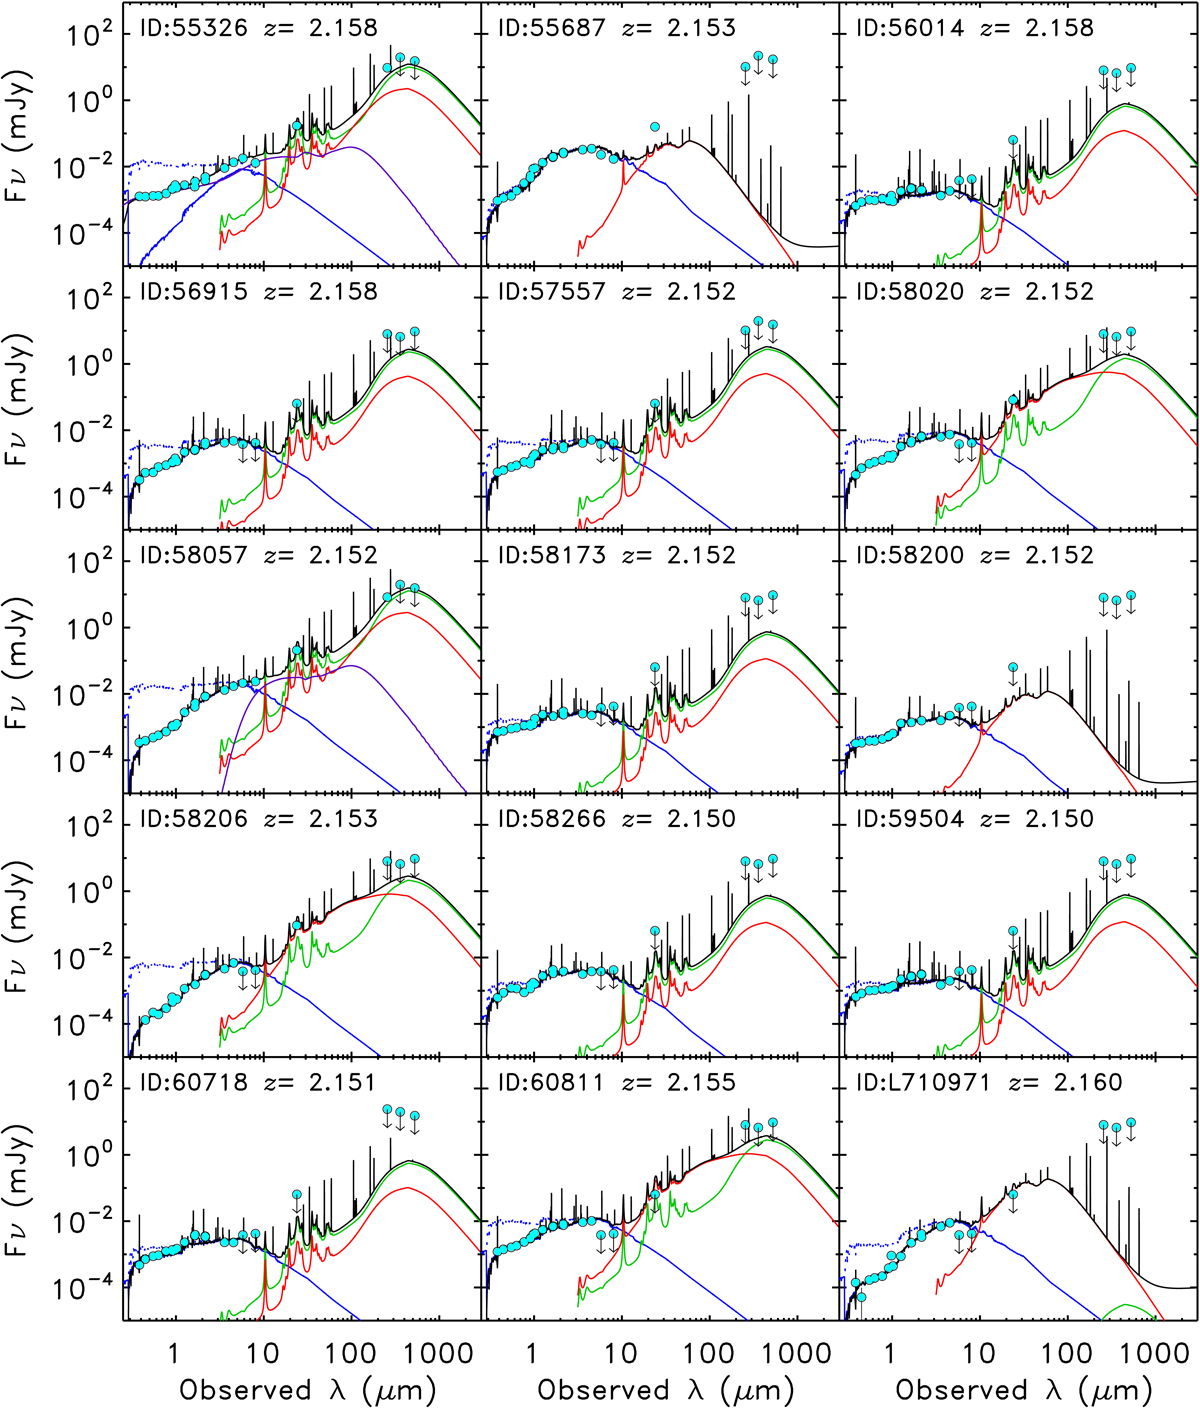
Fig. E.1.
Download original image
Observed spectral energy distributions (full cyan circles) and best fit templates (black lines) obtained with CIGALE at the spectroscopic redshift. Downward arrows are 5σ upper limits. The blue solid and dotted lines represent the stellar component after and before intrinsic extinction is applied. The green and red lines represent emission from dust. The purple line represents an AGN component, present only in IDs 55326, and 58057. Source ID and spectroscopic redshifts are annotated.
Current usage metrics show cumulative count of Article Views (full-text article views including HTML views, PDF and ePub downloads, according to the available data) and Abstracts Views on Vision4Press platform.
Data correspond to usage on the plateform after 2015. The current usage metrics is available 48-96 hours after online publication and is updated daily on week days.
Initial download of the metrics may take a while.