Fig. C.1.
Download original image
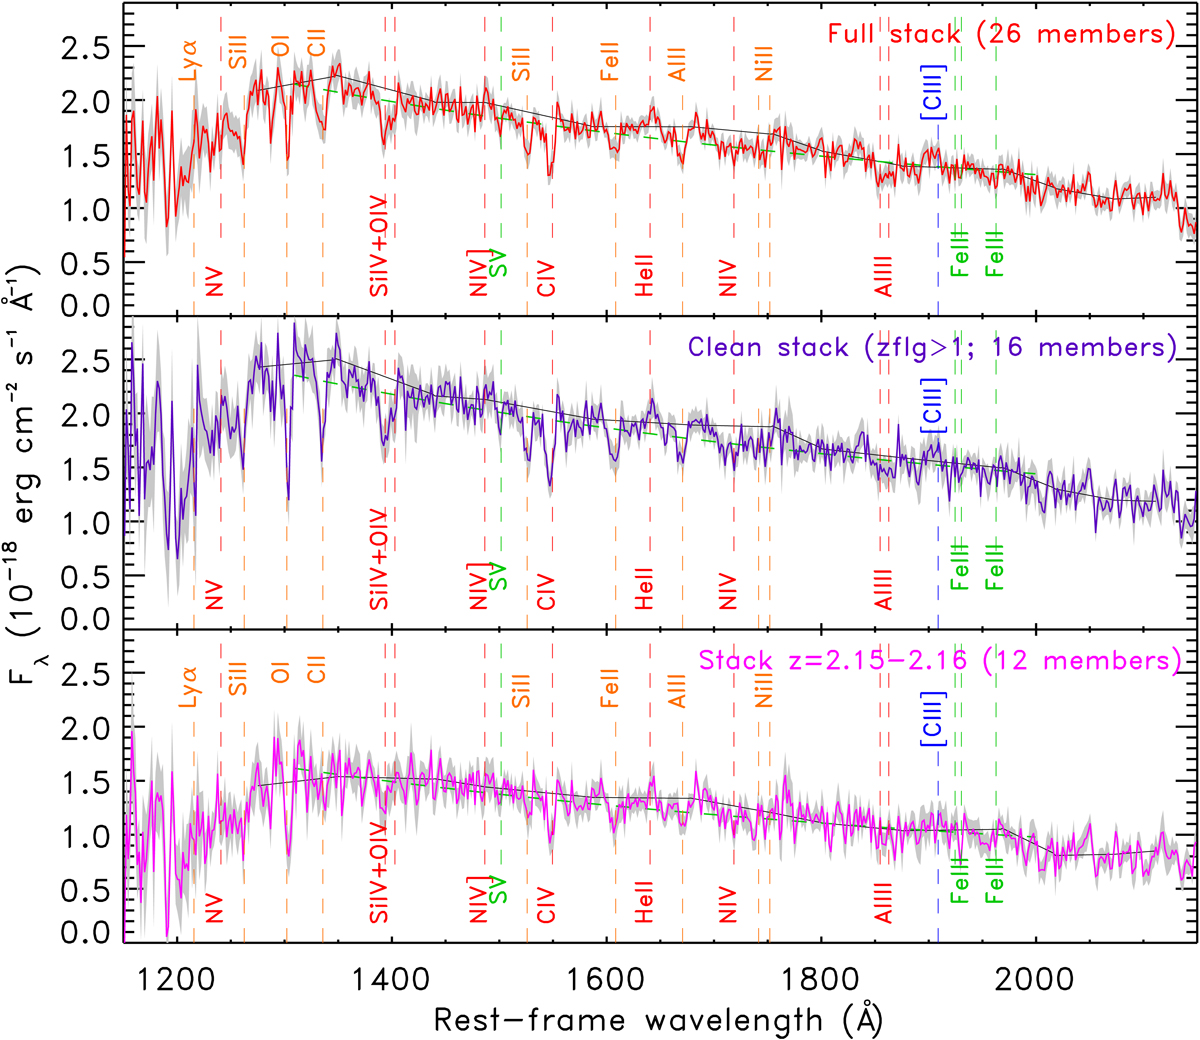
Stacked rest-frame VIMOS spectra of 26 member candidates with z = 2.15–2.20 (red solid line in top panel), of 16 members with zflg≥2 (purple solid line in middle panel), and of 12 members with z = 2.15–2.16 (magenta solid line in bottom panel). In all panels, the gray filled region represents the 1σ uncertainty, the dashed green line is a linear fit obtained to estimate the UV spectral slope β, where Fλ ∝ λβ, and the solid black curve represents the pseudo-continuum obtained by linearly interpolating the average flux density in the "features-free" windows defined in Table 3 in Rix et al. (2004). The vertical dashed lines represent the location of the main spectral features as annotated (nebular: blue, ISM: orange, stellar photosphere: green, stellar winds: red).
Current usage metrics show cumulative count of Article Views (full-text article views including HTML views, PDF and ePub downloads, according to the available data) and Abstracts Views on Vision4Press platform.
Data correspond to usage on the plateform after 2015. The current usage metrics is available 48-96 hours after online publication and is updated daily on week days.
Initial download of the metrics may take a while.