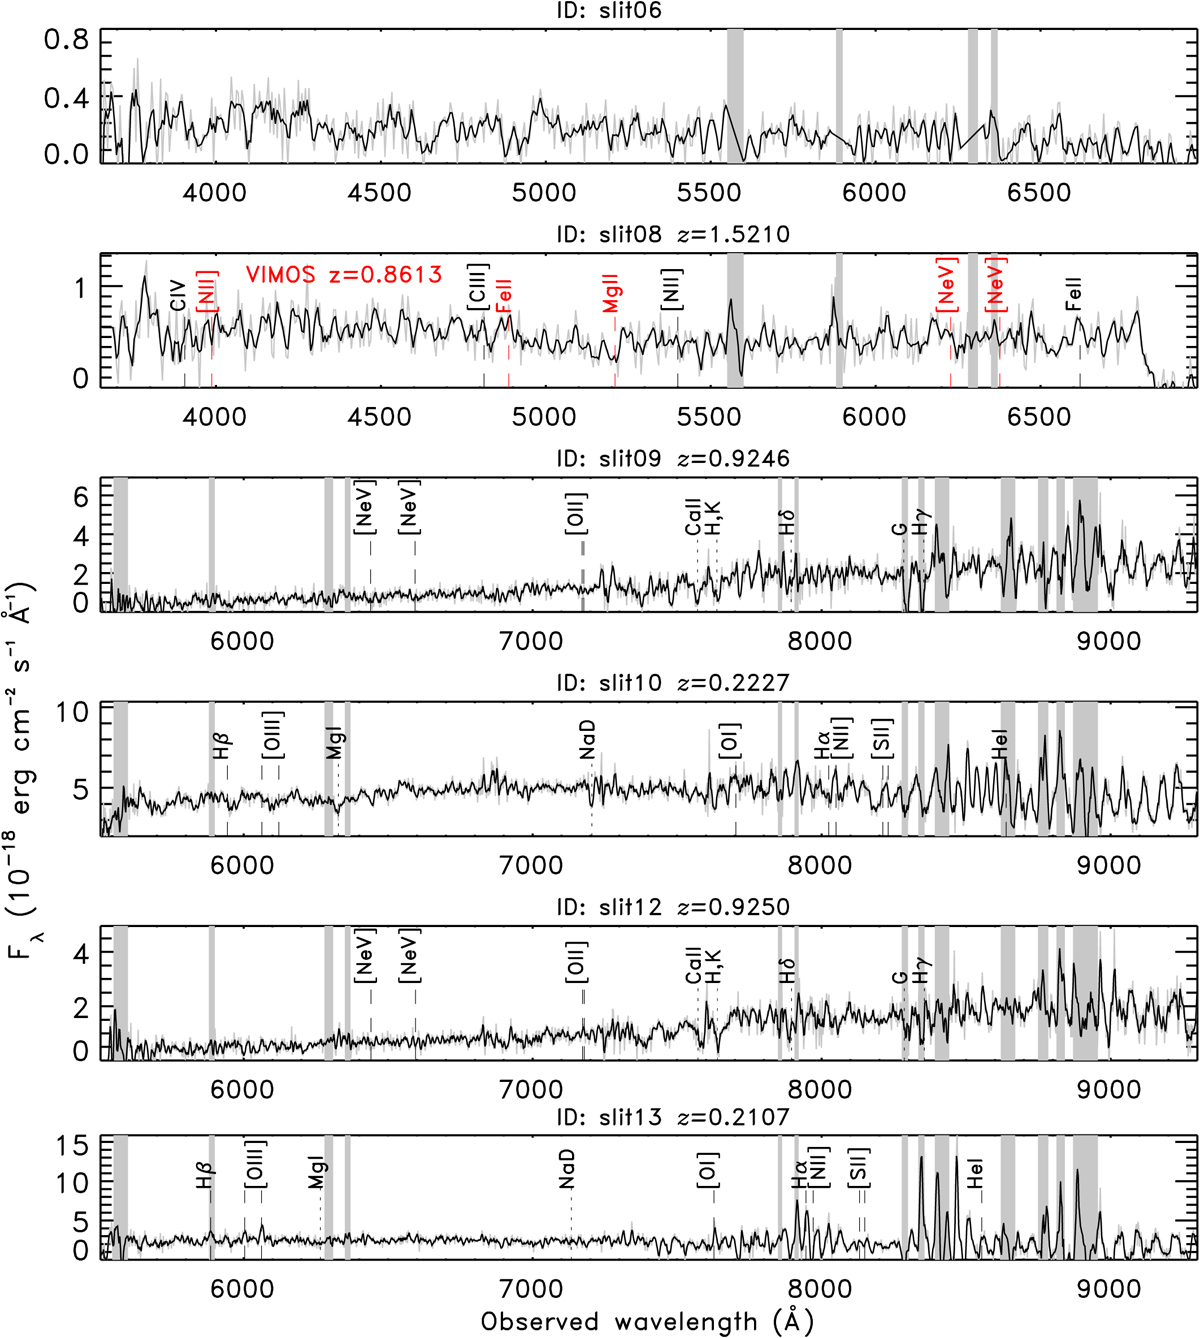
Fig. A.2.
Download original image
zCosmos-Deep VIMOS spectra of the sources observed with LBT/LUCI (gray line, in black after rebinning). Identifiers and spectroscopic redshifts are annotated at the top of each panel. The main emission and absorption lines are shown with vertical dashed, or dotted lines, respectively. Spectral regions contaminated by bright sky lines are marked with gray vertical bands. In case of ID slit08, we show the spectral features expected at the LBT/LUCI redshift in black, and those at the VIMOS optical redshift in red. The LUCI redshift is more reliable than the VIMOS one in this case.
Current usage metrics show cumulative count of Article Views (full-text article views including HTML views, PDF and ePub downloads, according to the available data) and Abstracts Views on Vision4Press platform.
Data correspond to usage on the plateform after 2015. The current usage metrics is available 48-96 hours after online publication and is updated daily on week days.
Initial download of the metrics may take a while.