Fig. 20.
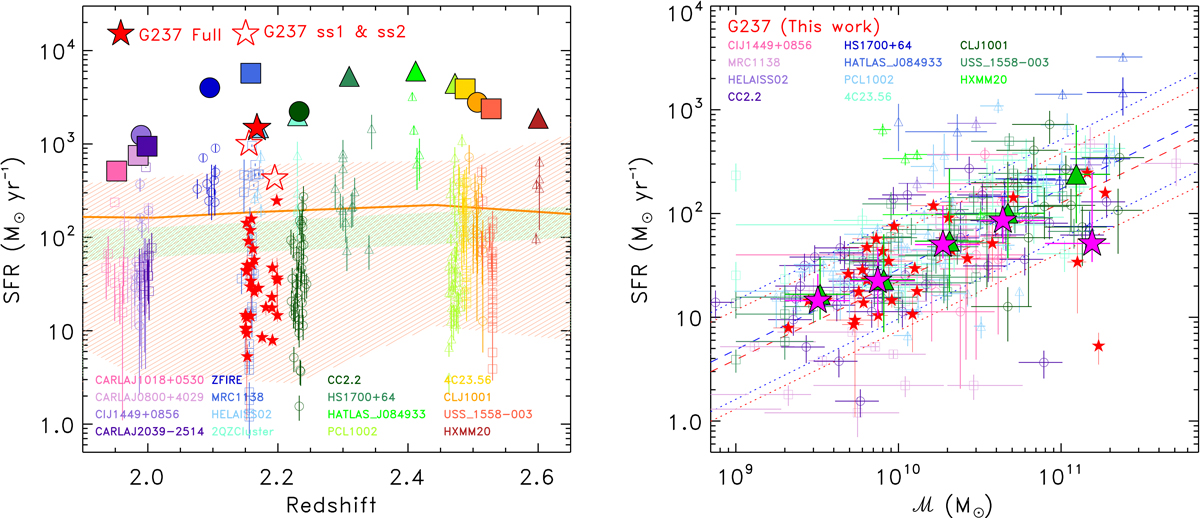
Download original image
SFR as a function of redshifts (left panel) and of stellar mass (right panel) of the spectroscopic members in G237 (small filled red stars) and in 16 (11 in the right panel because stellar masses for individual members were not available for all) protoclusters at 1.9 ≲z < 3 from the literature (open triangles: sub-mm protoclusters, open circles: color selected (i.e., red optical-NIR sources or HAEs), or open squares: searches around HzRGs). The protocluster names are annotated (for more details see Table 10). Left panel: large symbols represent total SFRs. Predictions from the empirical models of Behroozi et al. (2013) (green hatched region), from the 25 most massive z = 0 clusters in the TNG300 simulation (salmon hatched area), and the median SFR of the five most massive TNG300 simulated clusters (salmon thick line) (adapted from Lim et al. 2021) are shown for comparison. Right panel: large full green triangles and large full magenta stars are mean SFRs per stellar mass bins for the literature samples with z < 2.5, and for G237, respectively. Dashed blue and red lines are the MS relation at z = 2, and 2.6 as parameterized by Speagle et al. (2014), respectively, after correcting it for a Chabrier (2003) IMF. The dotted lines represent the scatter around the MS, equivalent to a factor of 3.
Current usage metrics show cumulative count of Article Views (full-text article views including HTML views, PDF and ePub downloads, according to the available data) and Abstracts Views on Vision4Press platform.
Data correspond to usage on the plateform after 2015. The current usage metrics is available 48-96 hours after online publication and is updated daily on week days.
Initial download of the metrics may take a while.