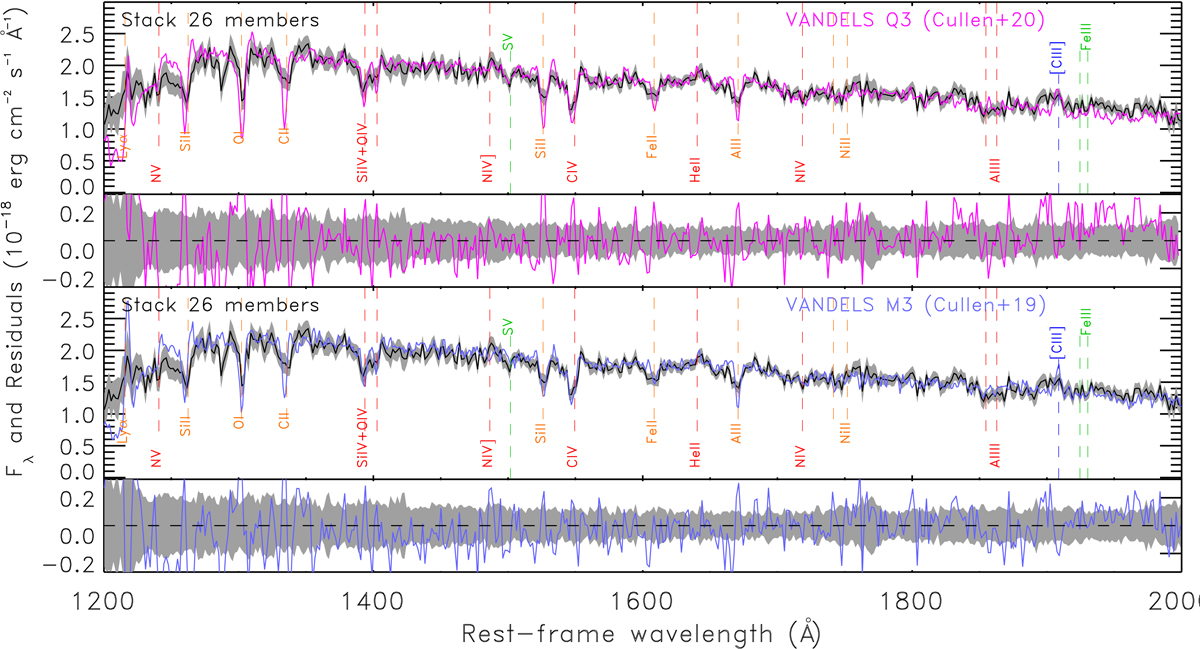
Fig. 14.
Download original image
Stacked spectrum (black solid line) and 1σ uncertainty (gray filled area) compared with composite spectra obtained from stacking the VANDELS spectra of two LAE subsamples: Q3 (top panel: magenta line); and m3 (bottom panel: blue line) (Cullen et al. 2019, 2020). Below each panel residuals are plotted and the 1σ uncertainty (gray shaded area) associated with our stack. The main spectral features are highlighted with vertical dashed lines and annotated.
Current usage metrics show cumulative count of Article Views (full-text article views including HTML views, PDF and ePub downloads, according to the available data) and Abstracts Views on Vision4Press platform.
Data correspond to usage on the plateform after 2015. The current usage metrics is available 48-96 hours after online publication and is updated daily on week days.
Initial download of the metrics may take a while.