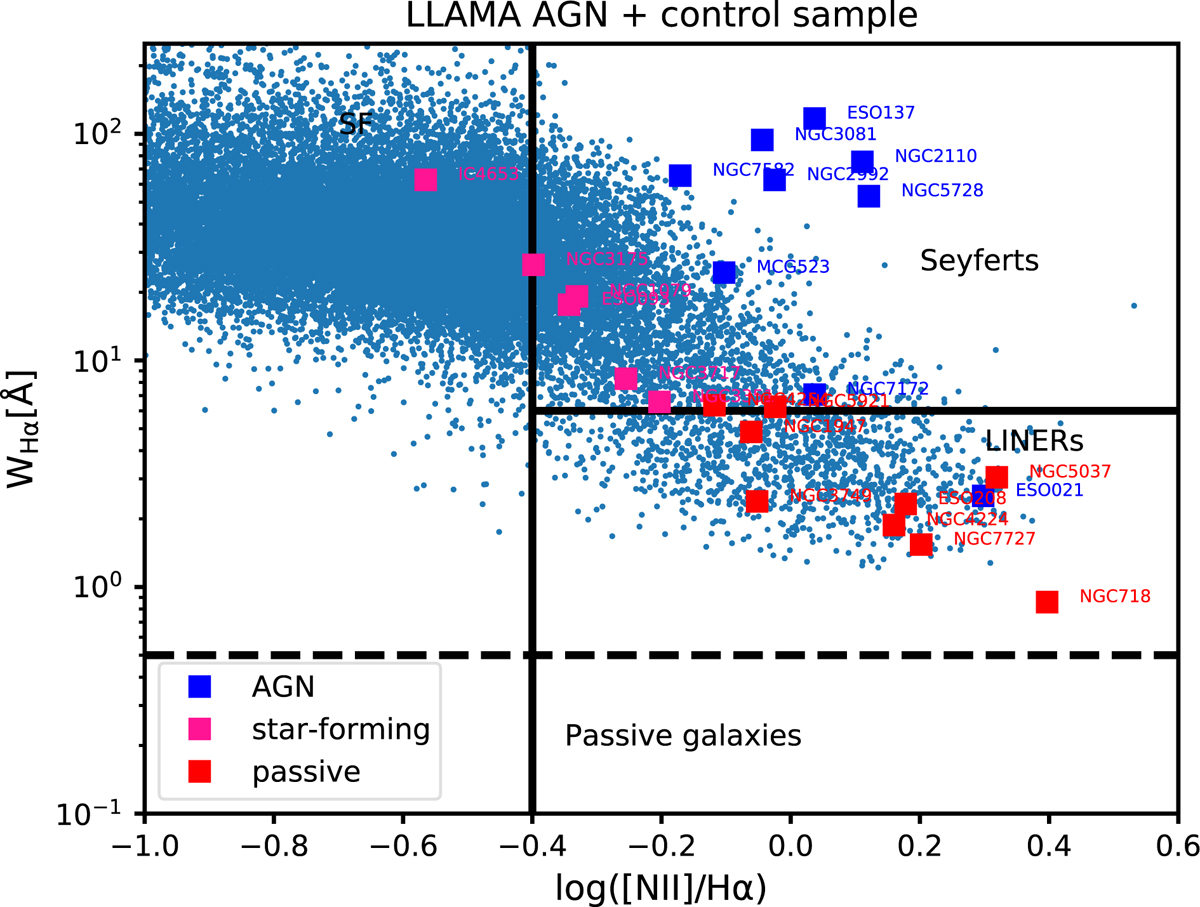
Fig. 14.
Download original image
WHaN plot showing the equivalent width of Hα on the y axis versus the BPT flux ratio [N II]/Hα. Galaxies from the AGN as well as the control sample of star-forming and passive galaxies are shown in blue, deep pink, and red, respectively. This plot is useful to show the relative strength of emission line features compared to the continuum. The demarcation lines are from Cid Fernandes et al. (2011). The blue cloud of points in the background is again from Brinchmann et al. (2004), as in Figs. 11–13.
Current usage metrics show cumulative count of Article Views (full-text article views including HTML views, PDF and ePub downloads, according to the available data) and Abstracts Views on Vision4Press platform.
Data correspond to usage on the plateform after 2015. The current usage metrics is available 48-96 hours after online publication and is updated daily on week days.
Initial download of the metrics may take a while.