Fig. 11.
Download original image
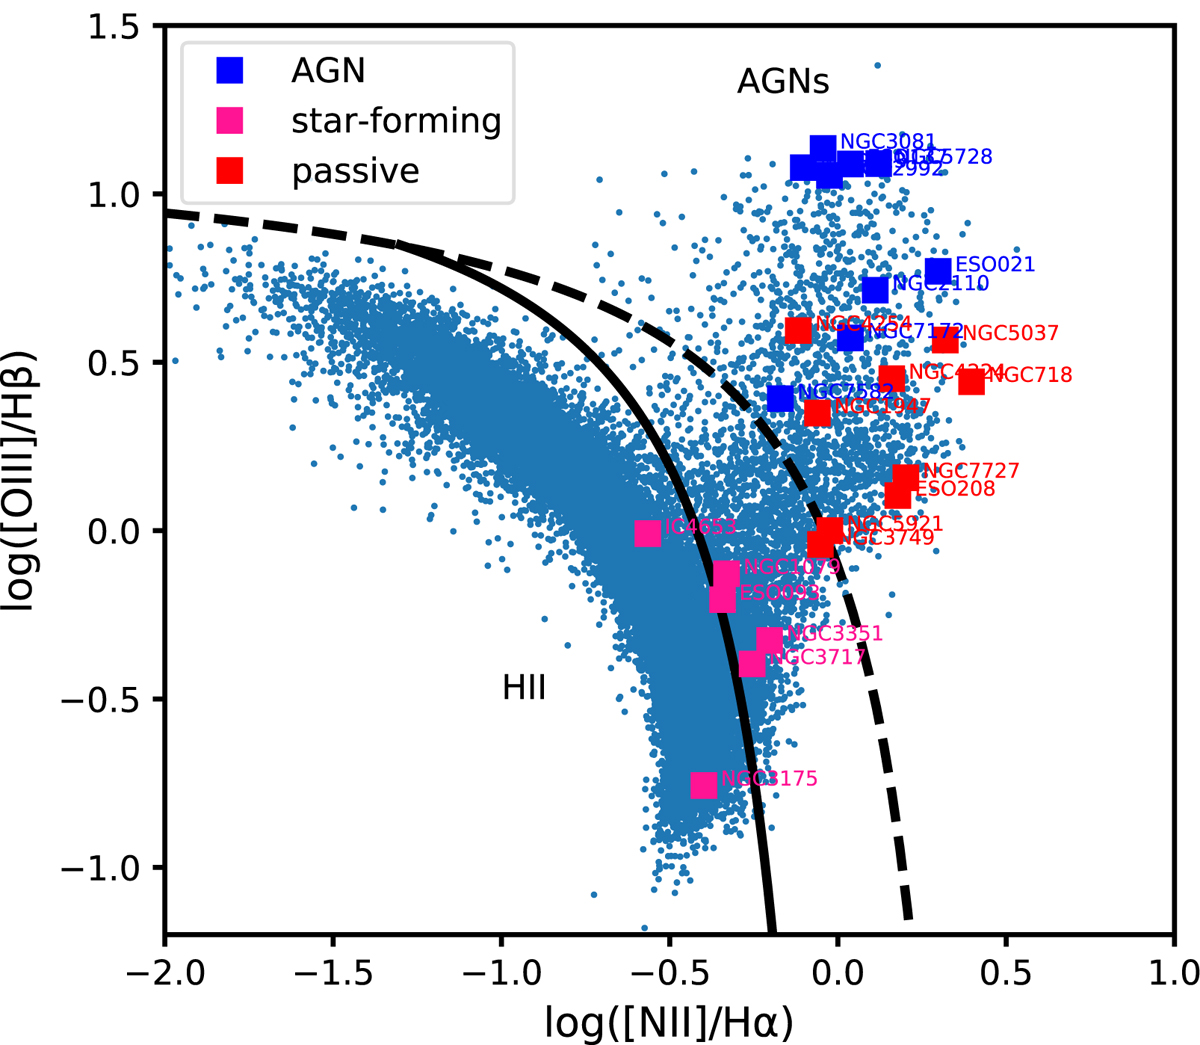
BPT plot with [OIII]/Hβ versus [N II]/Hα. Galaxies from the AGN as well as the control sample of star-forming and passive galaxies are shown in blue, deep pink, and red, respectively. The empirical (Kauffmann et al. 2003) and theoretical (Kewley et al. 2001) boundaries between starburst and AGN galaxies are marked with black straight and dashed lines, respectively. The underlying blue cloud of points is from the MPA-JHU emission line analysis of SDSS DR7 galaxies (Brinchmann et al. 2004).
Current usage metrics show cumulative count of Article Views (full-text article views including HTML views, PDF and ePub downloads, according to the available data) and Abstracts Views on Vision4Press platform.
Data correspond to usage on the plateform after 2015. The current usage metrics is available 48-96 hours after online publication and is updated daily on week days.
Initial download of the metrics may take a while.