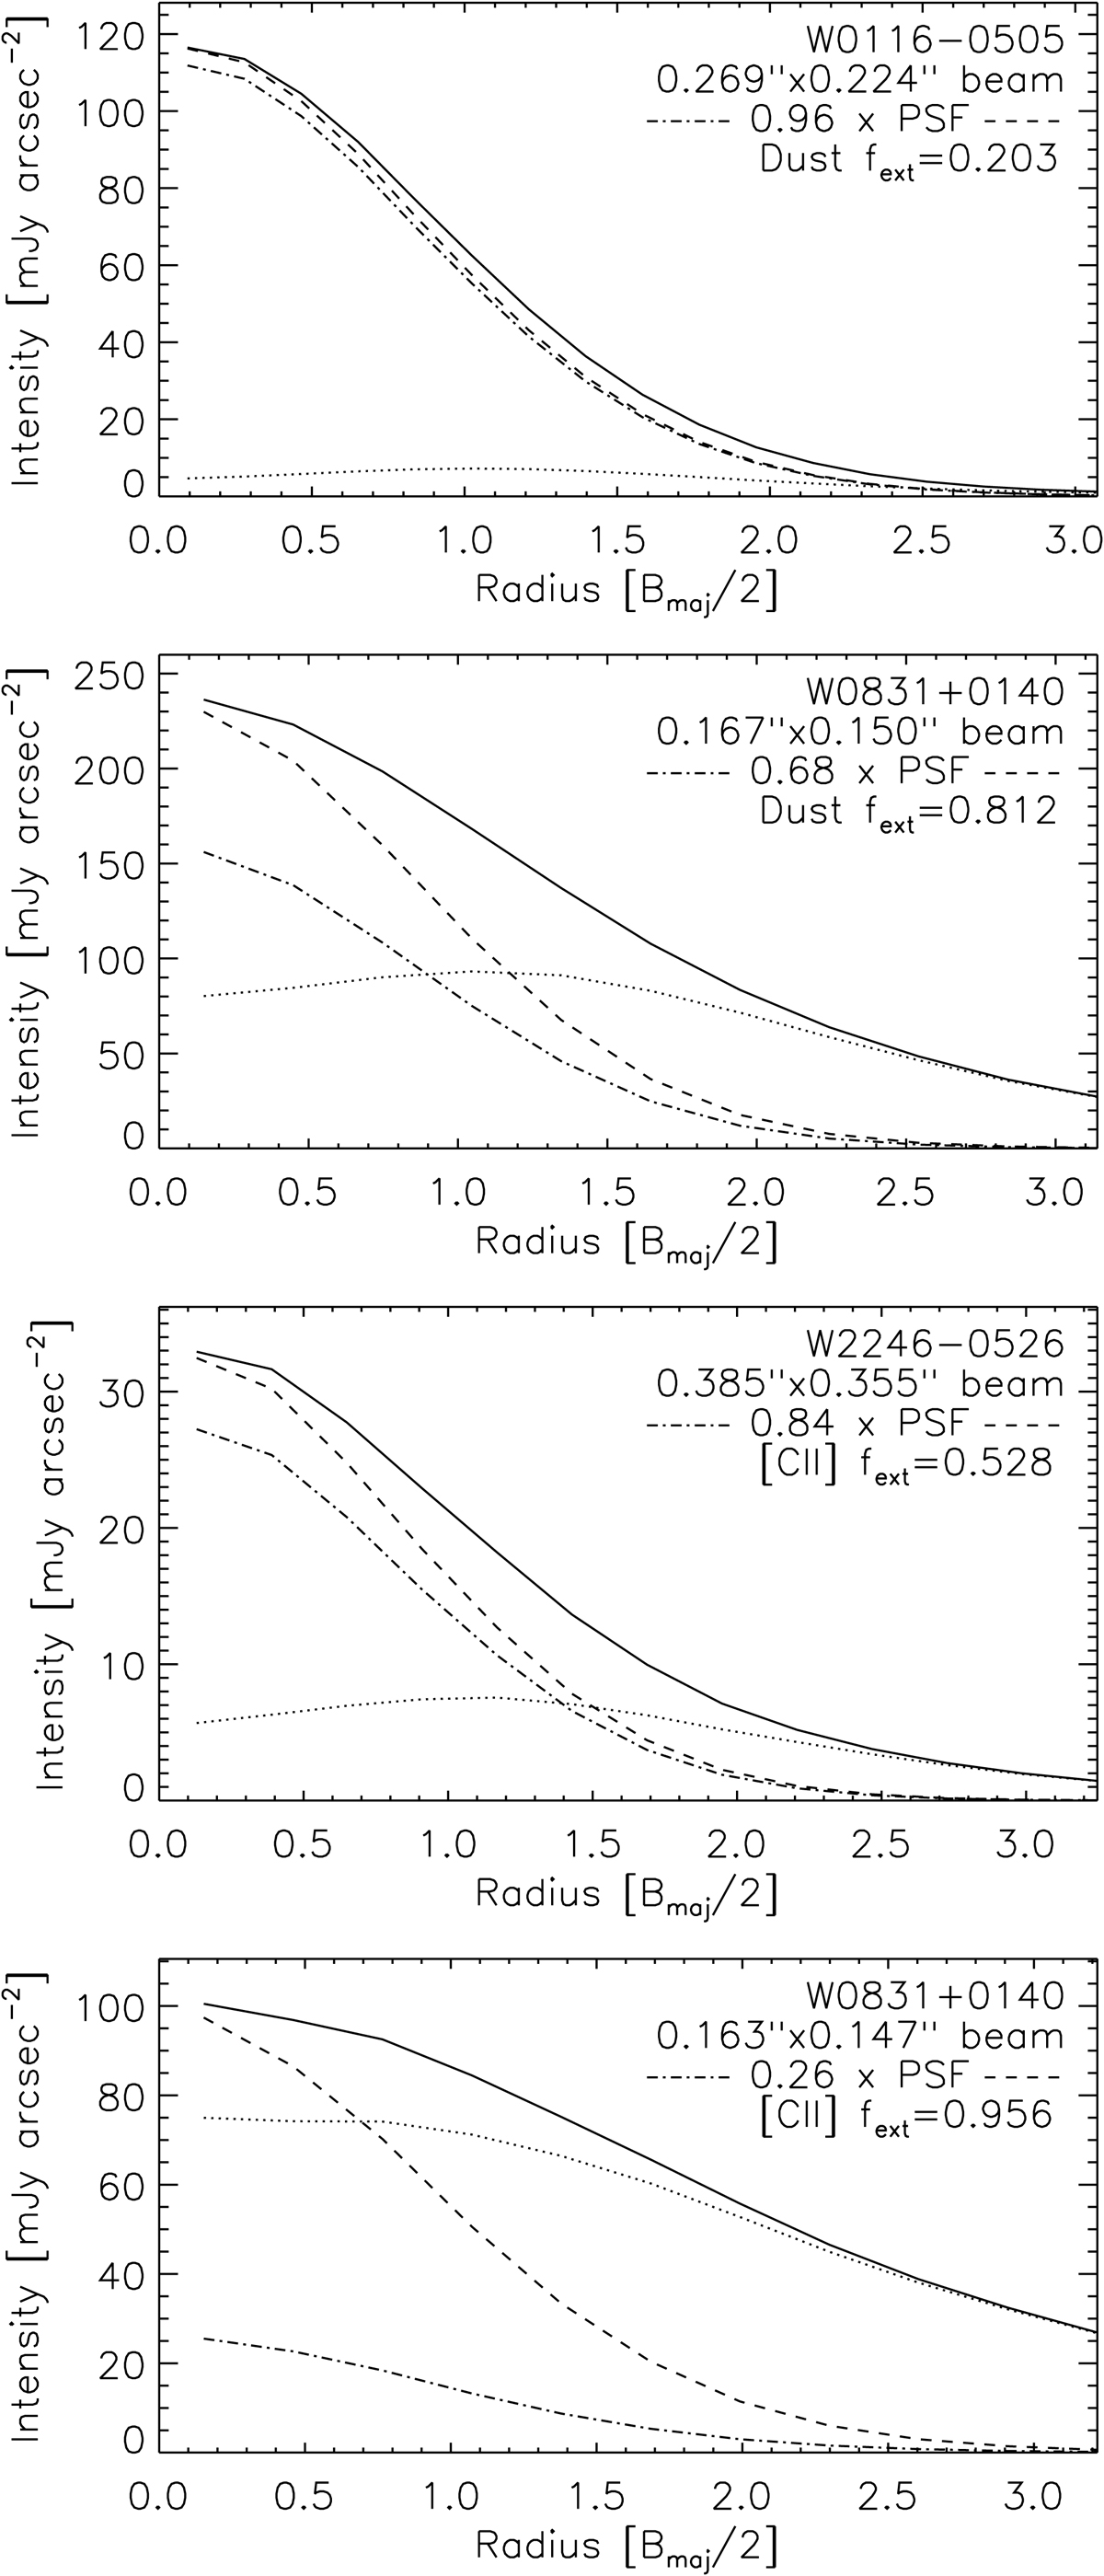
Fig. 8.
Download original image
Top two panels: Azimuthal profiles of the dust continuum flux density for the Hot DOGs with the smallest (top, W0116–0505) and largest (bottom, W0831+0140) fext, cont. Bottom two panels: Azimuthal profiles of the [C II] flux for the Hot DOGs with the smallest (top, W2246–0526) and largest (bottom, W0831+0140) fext, [CII]. The black line is the profile of the observed emission. The dashed line is the profile of the clean PSF. The dotted-dashed line is the scaled PSF that minimizes the scatter of the residuals within Bmaj/2 = 1 (see Sect. 3 for details and values in Tables 3 and 4). The dotted line is the profile of the residuals (observed – scaled-PSF). The PSF scaling value, fext and the radius used to perform the aperture photometry are noted at the top right of each panel (see dotted circumferences in Fig. 6).
Current usage metrics show cumulative count of Article Views (full-text article views including HTML views, PDF and ePub downloads, according to the available data) and Abstracts Views on Vision4Press platform.
Data correspond to usage on the plateform after 2015. The current usage metrics is available 48-96 hours after online publication and is updated daily on week days.
Initial download of the metrics may take a while.