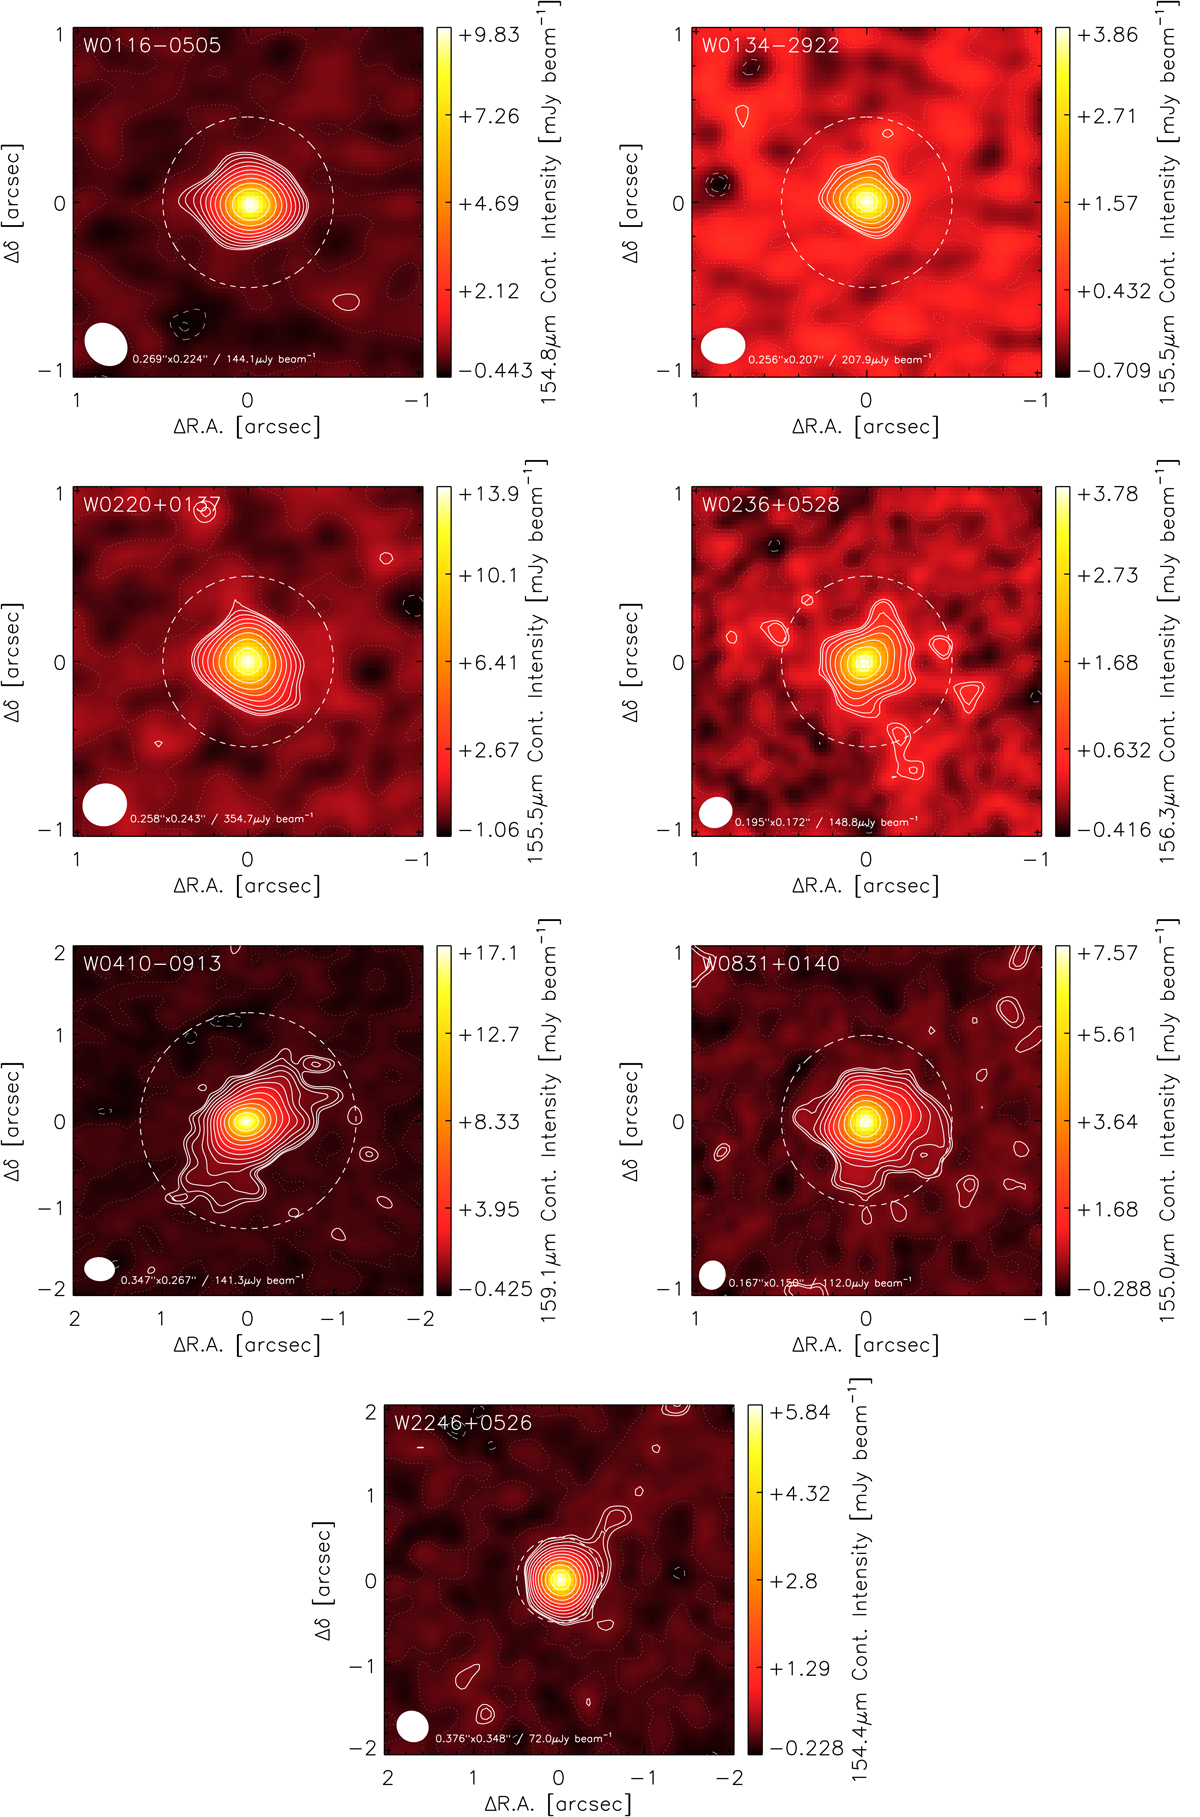
Fig. 6.
Download original image
Dust continuum flux density maps of the Hot DOG sample. The beam is shown as a white ellipse on the bottom-left, together with its size and the depth (rms) of the collapsed, line-subtracted cube. The dashed white circumference denotes the aperture used to extract the spectra shown in Fig. 2. The dotted contour shows the zero-flux intensity, and the solid contours represent the [2.5, 3.0, 2(4 + n)/2]-σ levels, where σ is the rms of the map and n = [0, 1, 2…]. Symmetric, negative levels are shown as dashed contours. Field of views (FoVs) of 2″ and 4″ on a side are displayed depending on the galaxy. Roughly, 1″ ≃ 7 kpc.
Current usage metrics show cumulative count of Article Views (full-text article views including HTML views, PDF and ePub downloads, according to the available data) and Abstracts Views on Vision4Press platform.
Data correspond to usage on the plateform after 2015. The current usage metrics is available 48-96 hours after online publication and is updated daily on week days.
Initial download of the metrics may take a while.