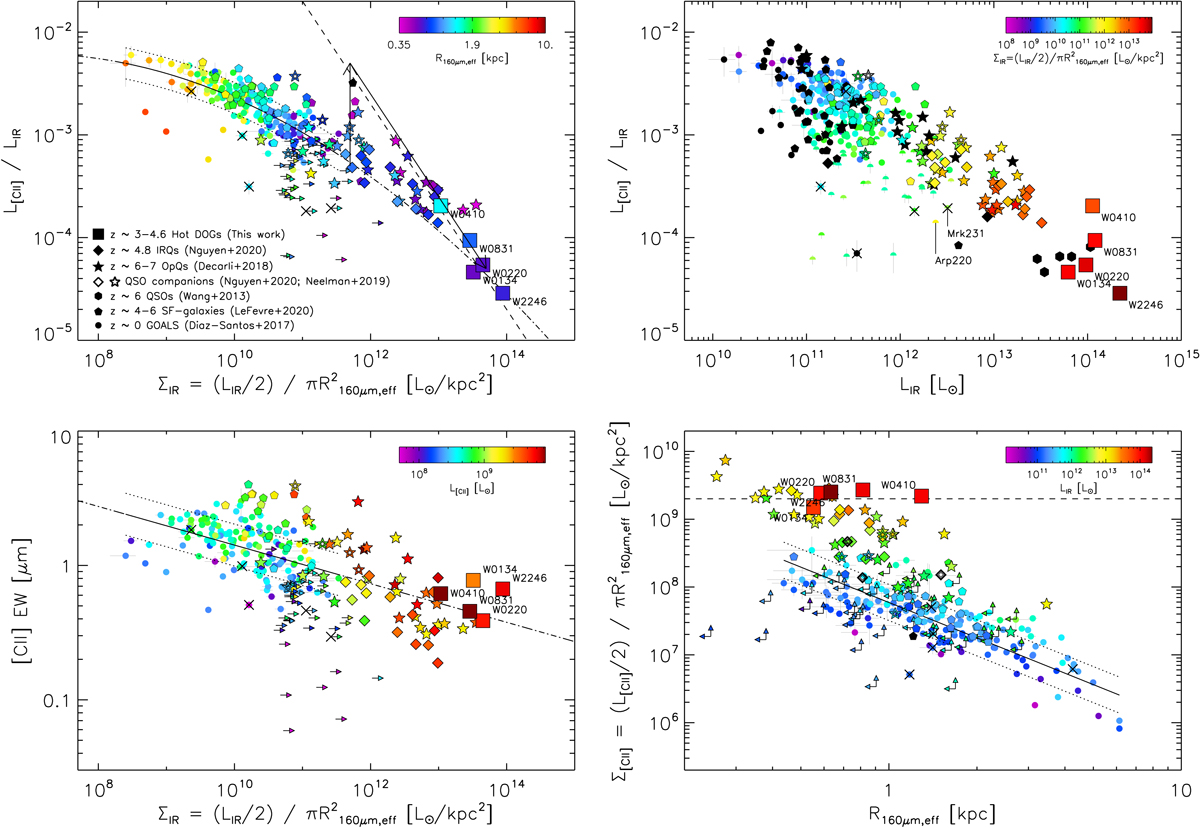
Fig. 5.
Download original image
Correlations between [C II] and IR luminosities, and far-IR sizes for the Hot DOG sample and the comparison high-z quasar and star-forming galaxy populations. Top-left: [C II] deficit (here defined as L[C II]/LIR) as a function of the IR luminosity surface density, ΣIR, color-coded as a function of the intrinsic 160 μm radius. Top-right: [C II] deficit as a function of LIR, color-coded as a function of ΣIR. Bottom-left: [C II] EW as a function of ΣIR, color-coded as a function of L[C II]. Bottom-right: [C II] surface density, Σ[CII], as a function of the intrinsic ∼160 μm radius (see Sect. 2.3), color-coded as a function of the IR luminosity. Hot DOGs are shown as squares, along with their names. The symbols of the comparison quasar samples are as in Fig. 3 (filled stars and diamonds). In addition, galaxy companions found in the neighborhood of some quasars in the sample of Decarli et al. (2018) are shown as open stars (from Neeleman et al. 2019). The local, z < 0.1 (U)LIRG sample from GOALS (Armus et al. 2009) is shown as small circles and limits (Díaz-Santos et al. 2017). Black crosses indicate local galaxies in which an AGN contributes ≥50% to the bolometric luminosity. In general, black symbols denote galaxies that do not have information regarding the property shown in the color bar. In all panels, the solid line is a fit to the local (U)LIRGs (the dotted lines show the 1σ standard deviation around the fit; see Díaz-Santos et al. 2017 for details), and the dotted-dashed line is the extrapolation toward lower and higher values of the x-axes. The dashed line in the top-left and bottom-right panels represents a constant Σ[CII] ≃ 2 × 10⁹ L⊙ kpc−2, that seems typical of the Hot DOG sample, independently of their LIR. The two arrows in the top-left panel refer to the discussion in Sect. 7.1. We note that in this figure we are using LIR to show the [C II] deficits and luminosity surface densities, rather than the more traditional approach of using LFIR that is commonly found in the literature.
Current usage metrics show cumulative count of Article Views (full-text article views including HTML views, PDF and ePub downloads, according to the available data) and Abstracts Views on Vision4Press platform.
Data correspond to usage on the plateform after 2015. The current usage metrics is available 48-96 hours after online publication and is updated daily on week days.
Initial download of the metrics may take a while.