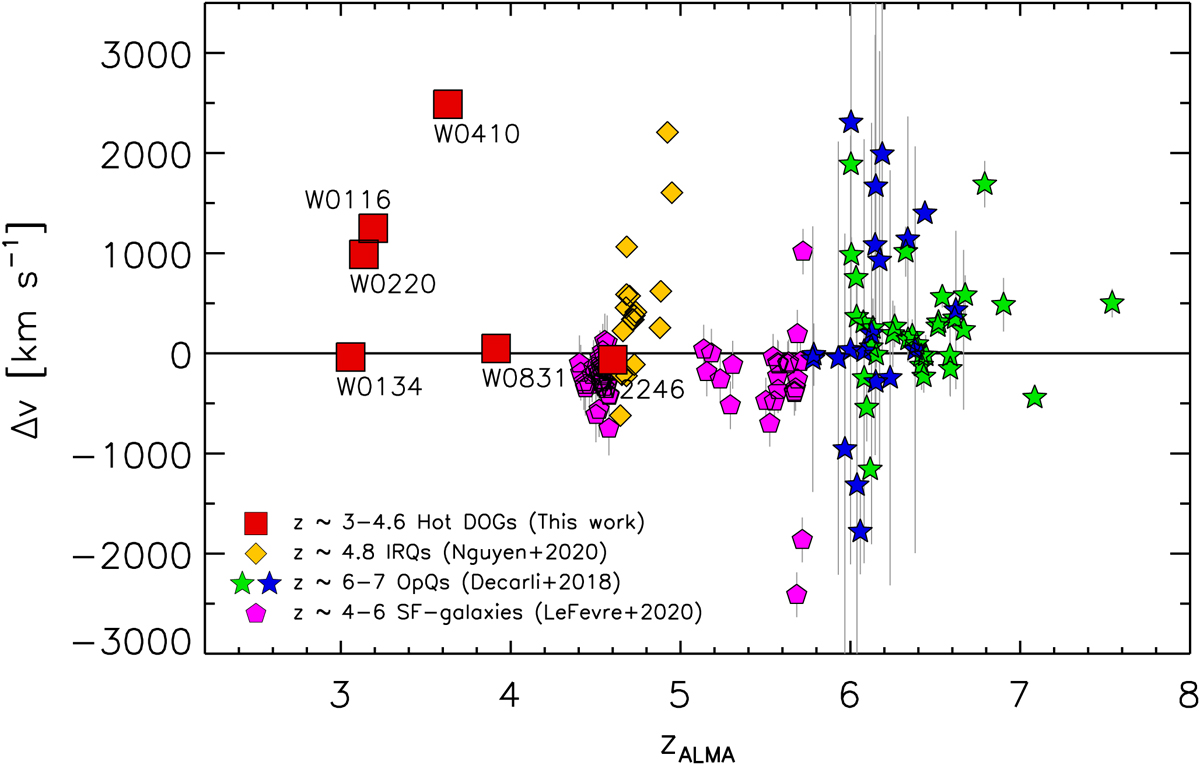
Fig. 3.
Download original image
Velocity shift of zALMA with respect to zUV, Δv, as a function of zALMA (see Table 3). Hot DOGs are displayed as red squares. The z ≃ 4.7 IRQs from Trakhtenbrot et al. (2017) and Nguyen et al. (2020) are represented as yellow pentagons. The compilation of z ≳ 6 OpQs from Decarli et al. (2018) are displayed as green stars when the optical redshift is based on the Mg II emission line, and as blue stars when other lines or methods are used. Star-forming galaxies at 4 < z < 6 from the ALPINE survey (Cassata et al. 2020) are shown as pink pentagons.
Current usage metrics show cumulative count of Article Views (full-text article views including HTML views, PDF and ePub downloads, according to the available data) and Abstracts Views on Vision4Press platform.
Data correspond to usage on the plateform after 2015. The current usage metrics is available 48-96 hours after online publication and is updated daily on week days.
Initial download of the metrics may take a while.