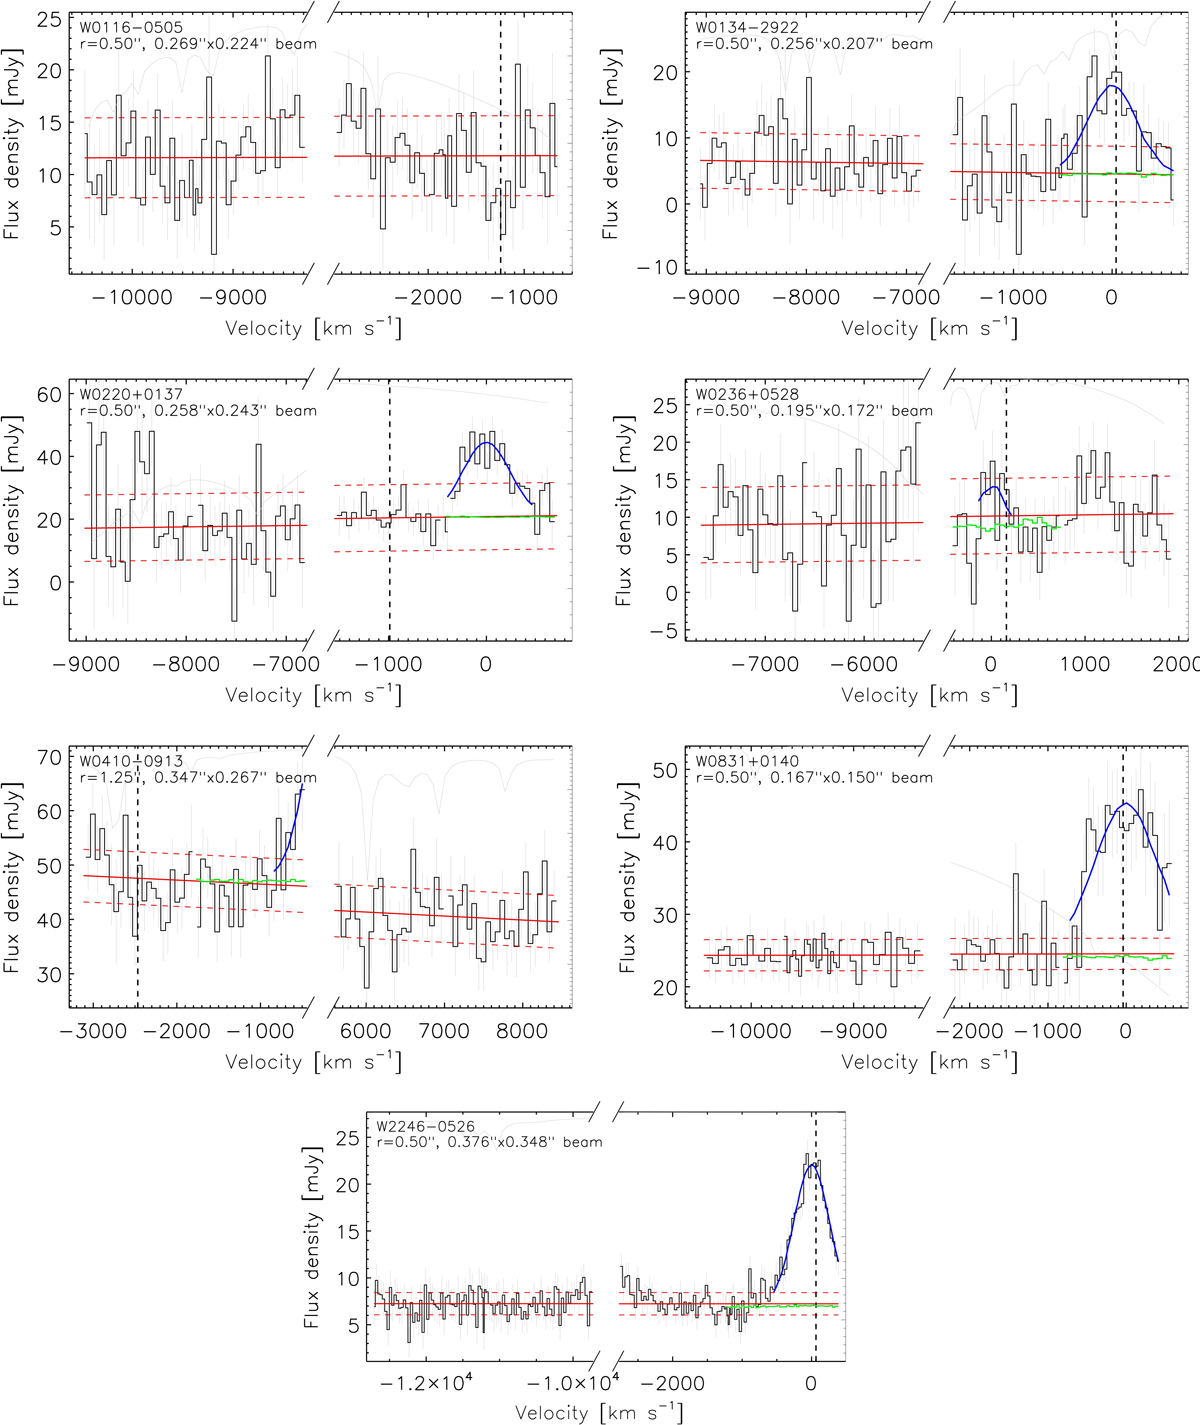
Fig. 2.

Download original image
ALMA spectra of the luminous Hot DOG sample, including the four SPWs (black histogram). The average size of the synthesized beam of the cube is noted in the legend at the top left, as well as the radius of the aperture used for the extraction of the spectra, which is also shown as a dashed circumference in Fig. 6. The continuum spectrum (obtained from the line-subtracted cube) underlying the emission line in each source is shown in green, and the Gaussian fit to the [C II] line is shown in blue. The polynomial fit to the overall line-subtracted continuum as well as its ±1σ uncertainty are shown in red, with solid and dashed lines, respectively. The solid gray lines are the atmospheric transmission curve for a precipitable water vapor of 1 mm3, where the maximum transmission within the displayed spectral range has been normalized to the maximum y-axis value of the whole velocity range displayed. The vertical dashed line shows the expected redshift of the line based on the rest-UV spectrum, zUV.
Current usage metrics show cumulative count of Article Views (full-text article views including HTML views, PDF and ePub downloads, according to the available data) and Abstracts Views on Vision4Press platform.
Data correspond to usage on the plateform after 2015. The current usage metrics is available 48-96 hours after online publication and is updated daily on week days.
Initial download of the metrics may take a while.


