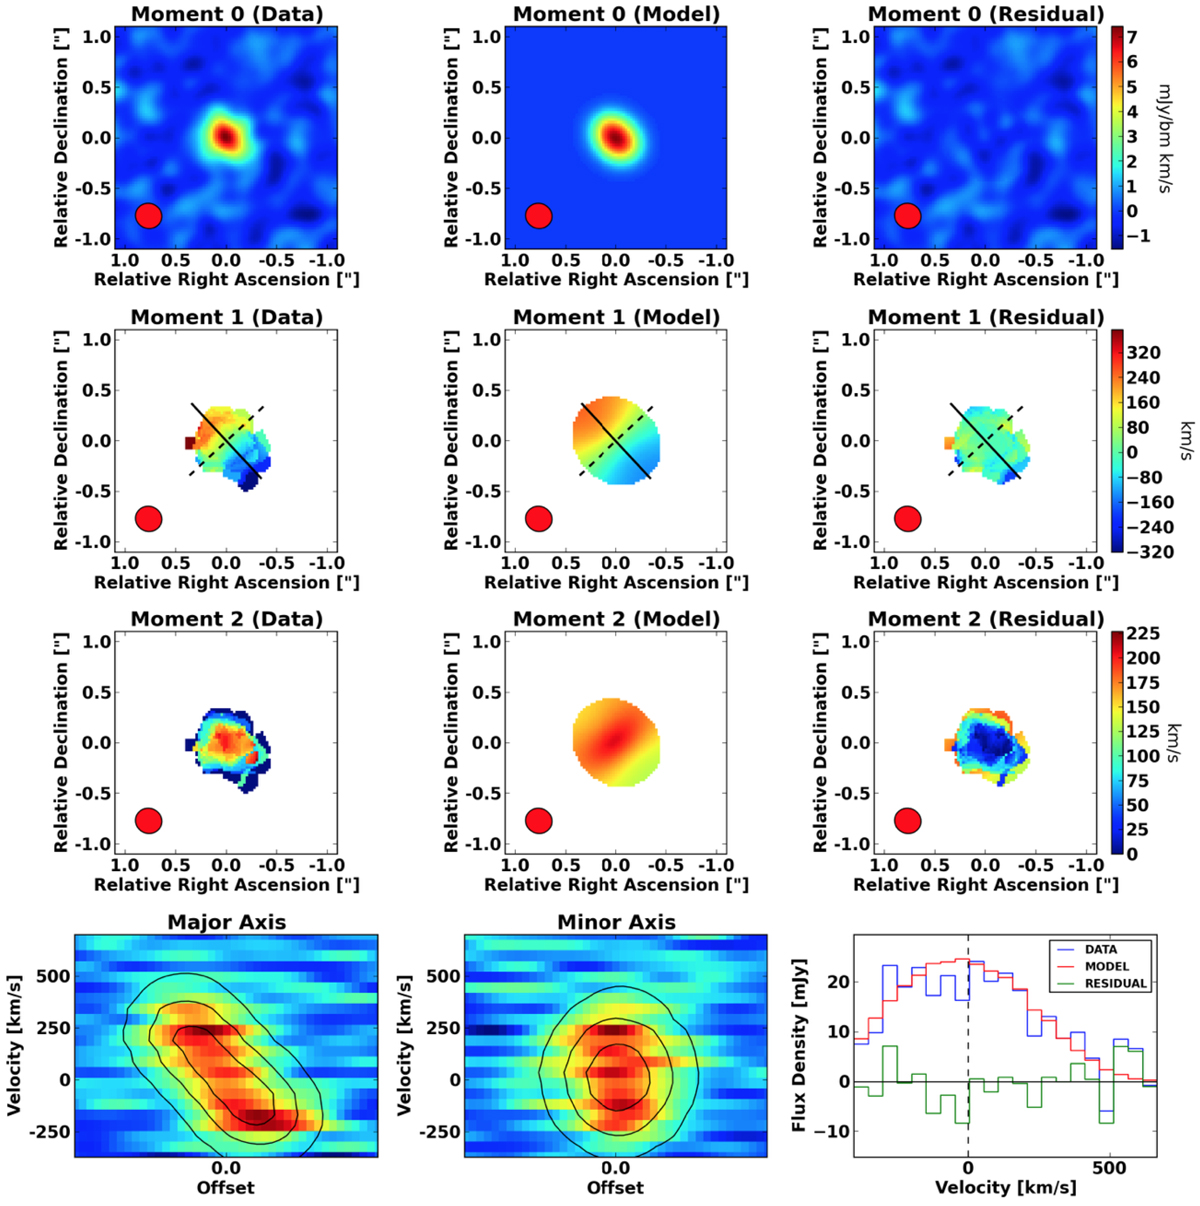
Fig. A.1.
Download original image
Dynamical modeling of W0220+0137 using BBarolo. The first three rows show the moment 0 (integrated intensity), moment 1 (velocity field), and moment 2 (velocity dispersion field) for the data and model cubes (created using the CASA toolkit task im.moments), as well as the difference between them. The solid lines in the second row represent the kinematic major axis, while the dashed lines represent the minor axis. In order to avoid the low-signal portion of the model, the model moment maps are only shown over the spaxels where the moment zero intensity is ≥1% of the maximum value. The bottom row shows (from left to right) the major axis postion-velocity diagram (PVD), minor axis PVD, and extracted spectra. For each PVD, the data is shown by the background color, while the overlaid contours represent the model. The data, model, and residual spectra in the bottom-right panle are depicted by the red, blue, and green lines, respectively.
Current usage metrics show cumulative count of Article Views (full-text article views including HTML views, PDF and ePub downloads, according to the available data) and Abstracts Views on Vision4Press platform.
Data correspond to usage on the plateform after 2015. The current usage metrics is available 48-96 hours after online publication and is updated daily on week days.
Initial download of the metrics may take a while.