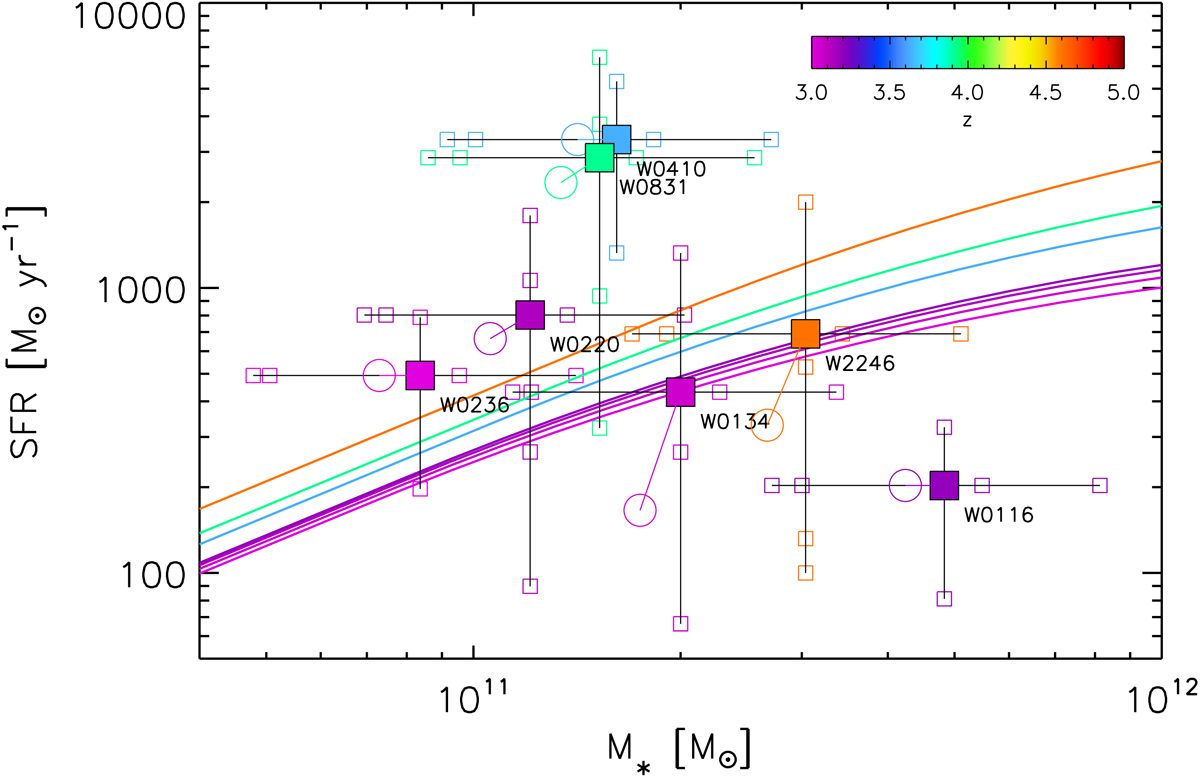
Fig. 13.
Download original image
SFR as a function of M⋆ for the host galaxies of the Hot DOG sample, color-coded as a function of redshift. The galaxy star-formation MS at the specific redshift of each source is represented by solid lines (from Schreiber et al. 2015) also colored to match their redshifts. Mean values of SFR and M⋆ are shown as solid squares; median values are shown as open circles. Small, open squares represent the individual M⋆ and SFR estimates based on the SED modeling and the assumed SFR histories and scaling relations (see text and Appendix B). Note that the error bars associated to the mean values do not represent standard deviations but rather extend the full range of individual estimates.
Current usage metrics show cumulative count of Article Views (full-text article views including HTML views, PDF and ePub downloads, according to the available data) and Abstracts Views on Vision4Press platform.
Data correspond to usage on the plateform after 2015. The current usage metrics is available 48-96 hours after online publication and is updated daily on week days.
Initial download of the metrics may take a while.