Fig. 4.
Download original image
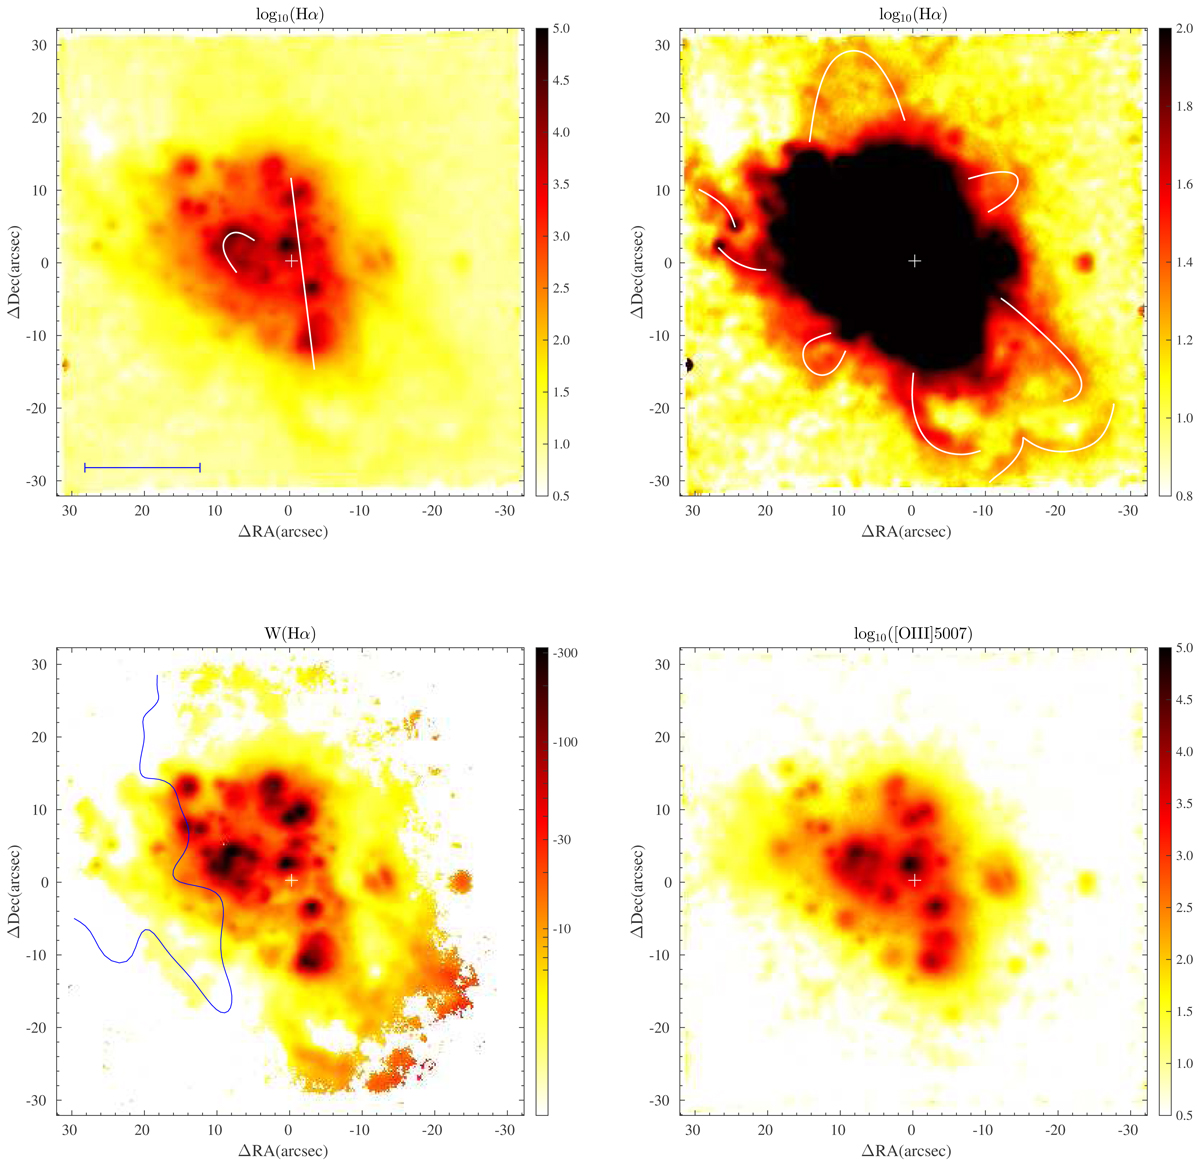
Haro 14 maps in emission lines: Top-left: Hα emission line flux map of Haro 14; the chain-like structure and the curvilinear feature in the central regions are indicated with white lines. The blue line (bottom-left) corresponds to 1 kpc. Top-right: Hα emission line flux map with the intensity in the inner galaxy regions saturated in order to enhance the faint surface brightness features in the outer galaxy parts; the white lines indicate the most prominent shells and filaments in the galaxy periphery. Bottom-left: Hα equivalent width map (in Å); the blue line roughly delineates the bluish regions of the galaxy at intermediate intensity levels. Bottom-right: [O III] λ5007 flux map. Flux units in the emission line maps are 10−20 erg s−1 cm−2 (per spaxel); the central white cross marks the position of the galaxy peak in continuum.
Current usage metrics show cumulative count of Article Views (full-text article views including HTML views, PDF and ePub downloads, according to the available data) and Abstracts Views on Vision4Press platform.
Data correspond to usage on the plateform after 2015. The current usage metrics is available 48-96 hours after online publication and is updated daily on week days.
Initial download of the metrics may take a while.