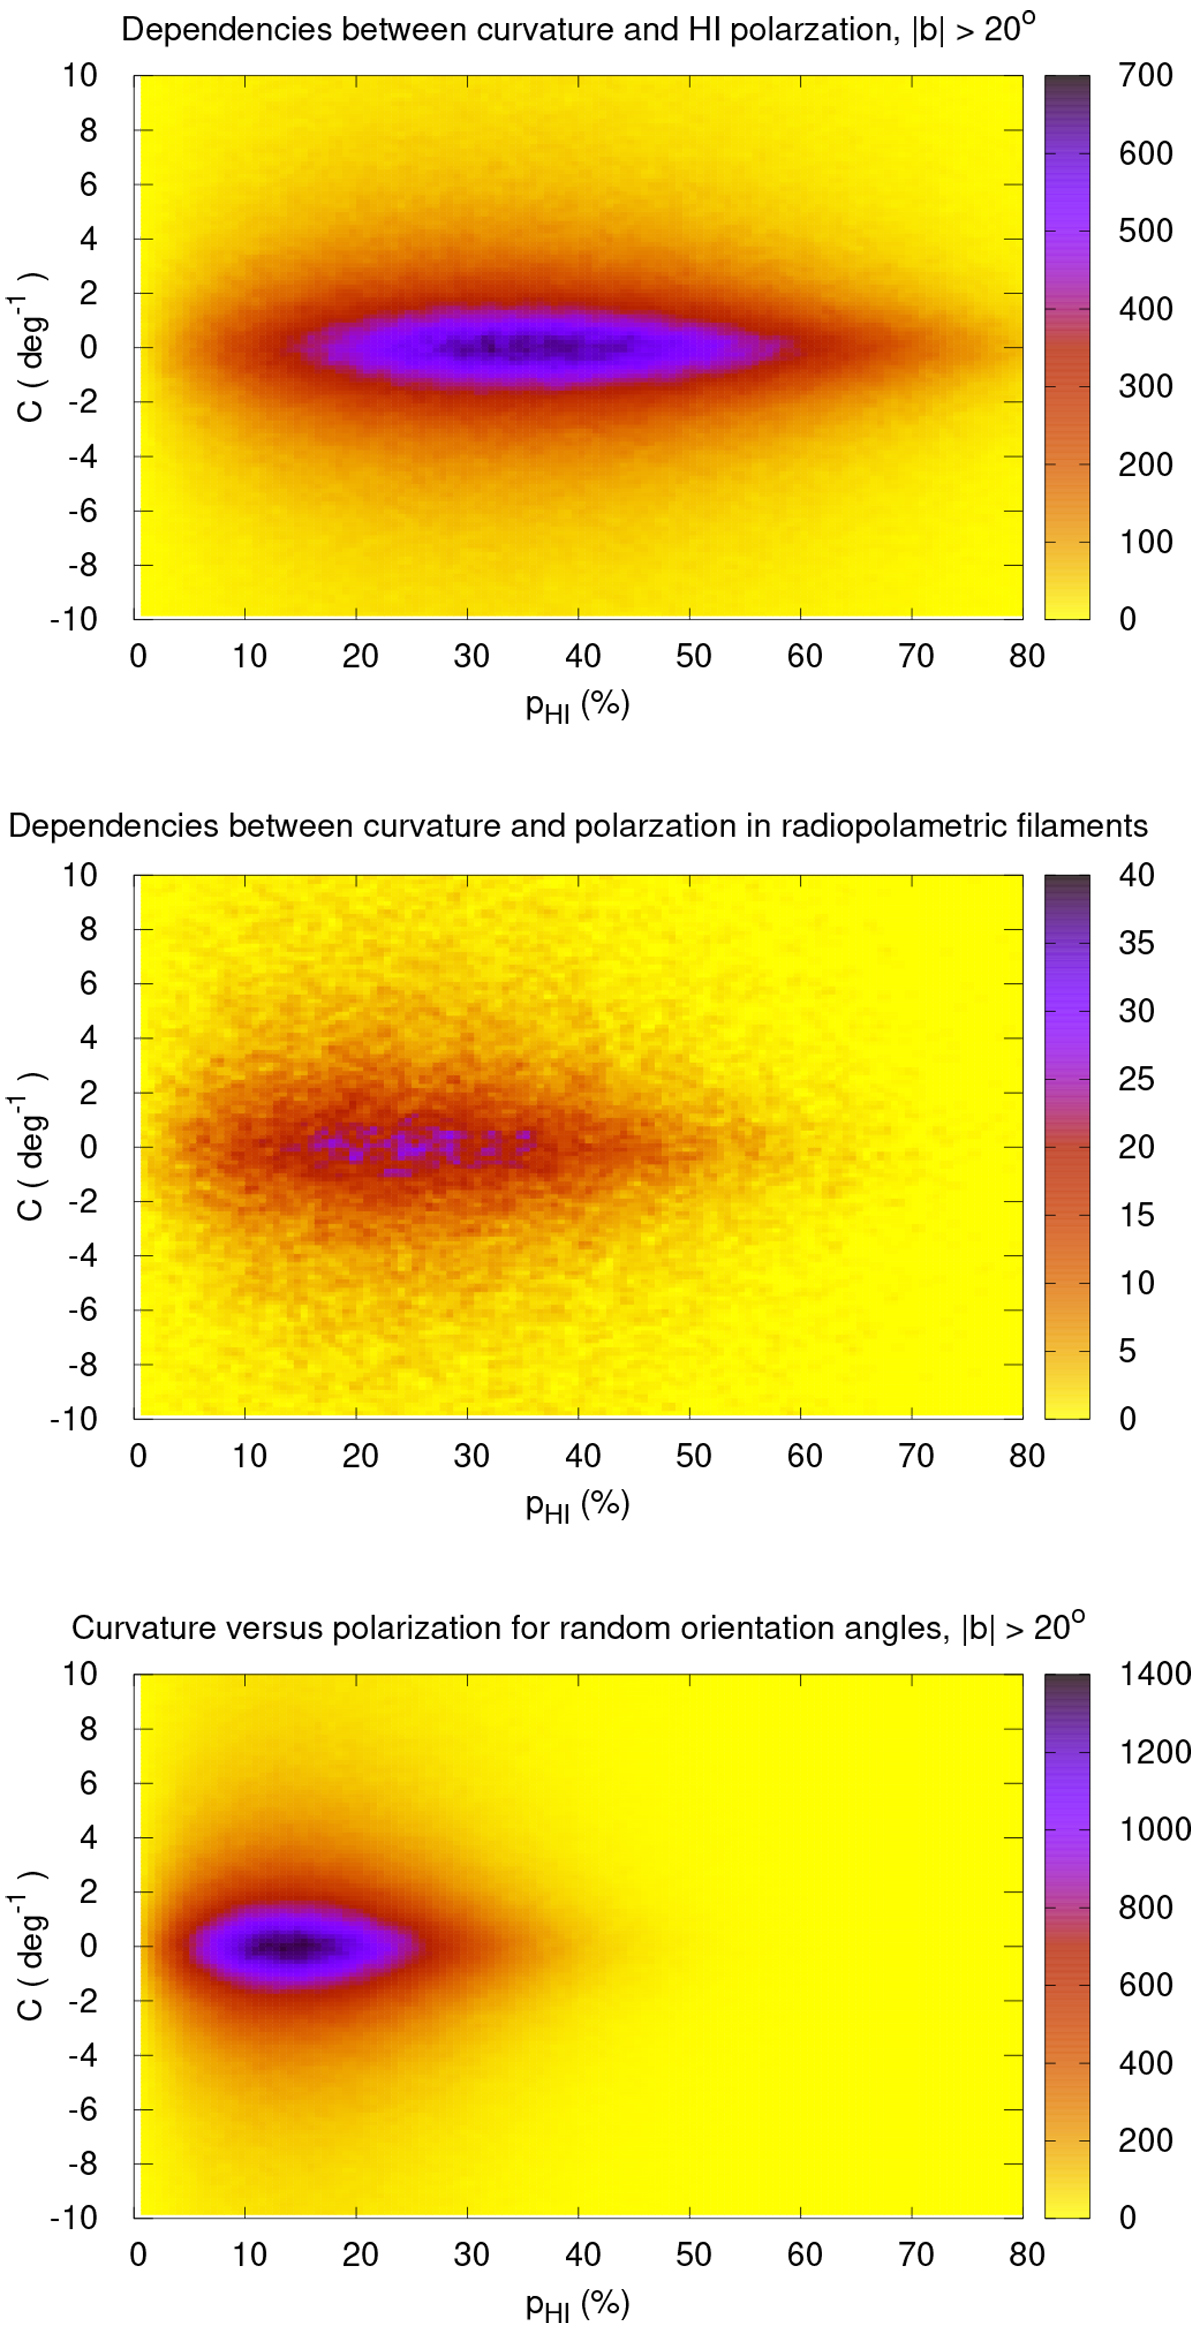
Fig. 22
Download original image
Two-dimensional density distribution of observed local filament curvatures C in comparison to H I polarization fraction. Top: high latitude sky. Middle: selected fields with strong H I anisotropies and associated radio-polarimetric filaments (Kalberla & Kerp 2016; Kalberla et al. 2017). Bottom: two-dimensional density distribution of spurious H I polarization derived by modeling a random distribution of orientation angles along the line of sight.
Current usage metrics show cumulative count of Article Views (full-text article views including HTML views, PDF and ePub downloads, according to the available data) and Abstracts Views on Vision4Press platform.
Data correspond to usage on the plateform after 2015. The current usage metrics is available 48-96 hours after online publication and is updated daily on week days.
Initial download of the metrics may take a while.