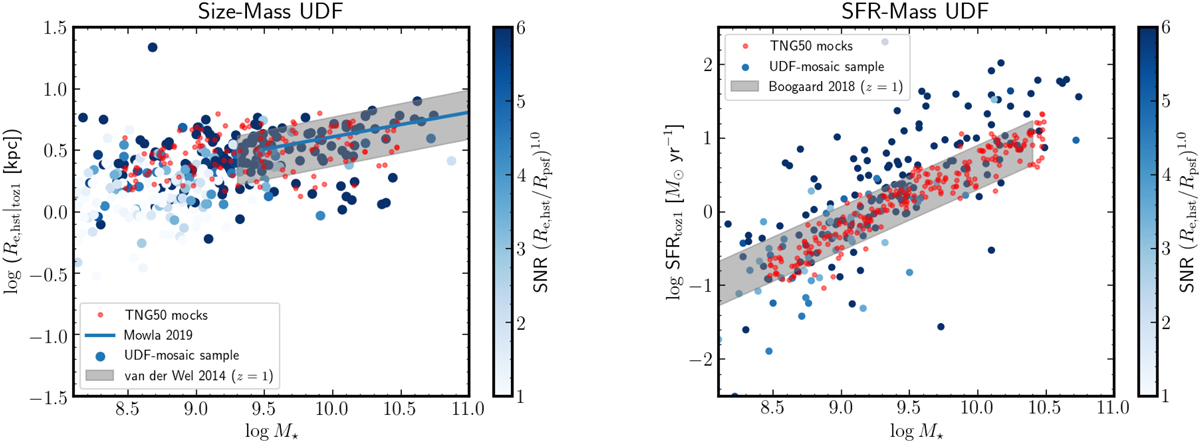
Fig. 9.
Download original image
Comparison of selection techniques. Left: size-mass relation for the SFGs in the UDF mosaic sample (blue circles). The sizes are adjusted to z = 1 according to the (1 + z)−0.5 evolution found by van der Wel et al. (2014). The solid line (gray band) represent the size-mass relation of Mowla et al. (2019) (van der Wel et al. 2014). Right: main-sequence relation for the SFGs in the UDF mosaic sample. The SFRs are adjusted to z = 1 according to the (1 + z)1.74 evolution of Boogaard et al. (2018) whose z = 1 main sequence is represented by the gray band. In both panels, the points are color-coded according to effective S/N. For comparison we show the properties of the mock 158 galaxies (Sect. 3.2) as red circles.
Current usage metrics show cumulative count of Article Views (full-text article views including HTML views, PDF and ePub downloads, according to the available data) and Abstracts Views on Vision4Press platform.
Data correspond to usage on the plateform after 2015. The current usage metrics is available 48-96 hours after online publication and is updated daily on week days.
Initial download of the metrics may take a while.