Fig. 6.
Download original image
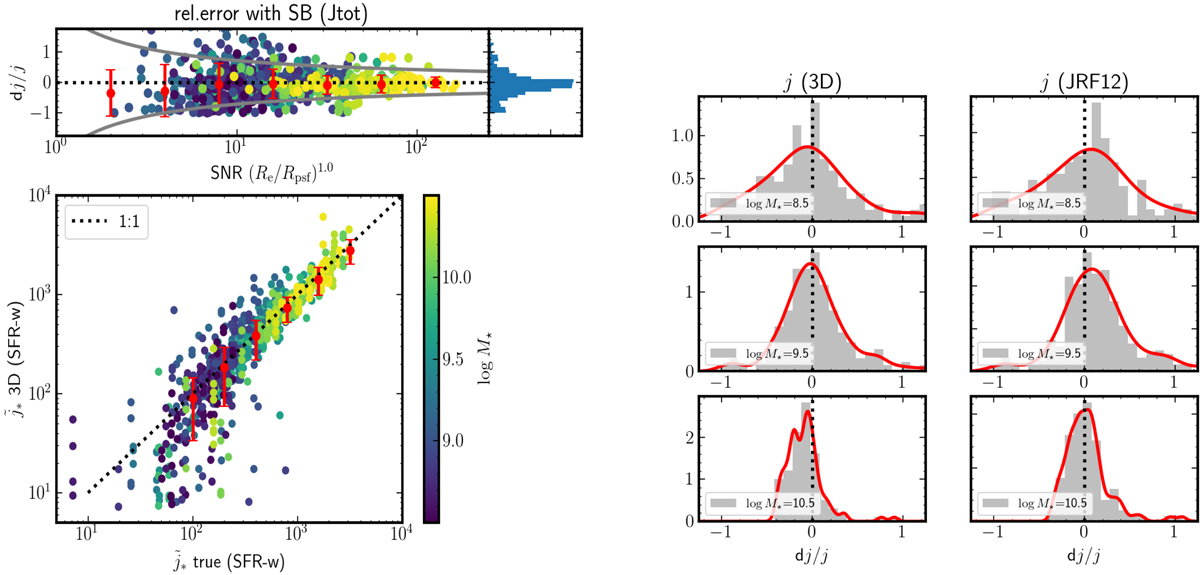
Reliability of our sAM estimator. Left: bottom panel: total SFR-weighted sAM, ![]() (in km s−1 kpc), as a function of the true angular momentum (SFR-weighted) for the 790 mock galaxies. Top panel: relative error (
(in km s−1 kpc), as a function of the true angular momentum (SFR-weighted) for the 790 mock galaxies. Top panel: relative error (![]() as a function of the effective S/N (see text) along with the histogram of
as a function of the effective S/N (see text) along with the histogram of ![]() . The points are colored according to the stellar mass in both panels. The red circles represent the median
. The points are colored according to the stellar mass in both panels. The red circles represent the median ![]() whose errorbar represent 1σ. Right: relative error (
whose errorbar represent 1σ. Right: relative error (![]() for each mass bin of 1 dex centered on log M⋆ = 8.5, 9.5, 10.5, from top to bottom. The histograms are weighted by the errors. Left (right) panels: distributions of
for each mass bin of 1 dex centered on log M⋆ = 8.5, 9.5, 10.5, from top to bottom. The histograms are weighted by the errors. Left (right) panels: distributions of ![]() , in three mass bins, resulting from the 3D method (the Eq. (3) approximation), respectively. The red solid line represents the continuous density estimation of the distributions using a Gaussian kernel with bandwidth of ∼0.2. This shows that, for massive galaxies (M⋆ > 1010 M⊙), the Eq. (3) approximation is less biased, while for galaxies with M⋆ < 1010 M⊙, the 3D method is less biased.
, in three mass bins, resulting from the 3D method (the Eq. (3) approximation), respectively. The red solid line represents the continuous density estimation of the distributions using a Gaussian kernel with bandwidth of ∼0.2. This shows that, for massive galaxies (M⋆ > 1010 M⊙), the Eq. (3) approximation is less biased, while for galaxies with M⋆ < 1010 M⊙, the 3D method is less biased.
Current usage metrics show cumulative count of Article Views (full-text article views including HTML views, PDF and ePub downloads, according to the available data) and Abstracts Views on Vision4Press platform.
Data correspond to usage on the plateform after 2015. The current usage metrics is available 48-96 hours after online publication and is updated daily on week days.
Initial download of the metrics may take a while.