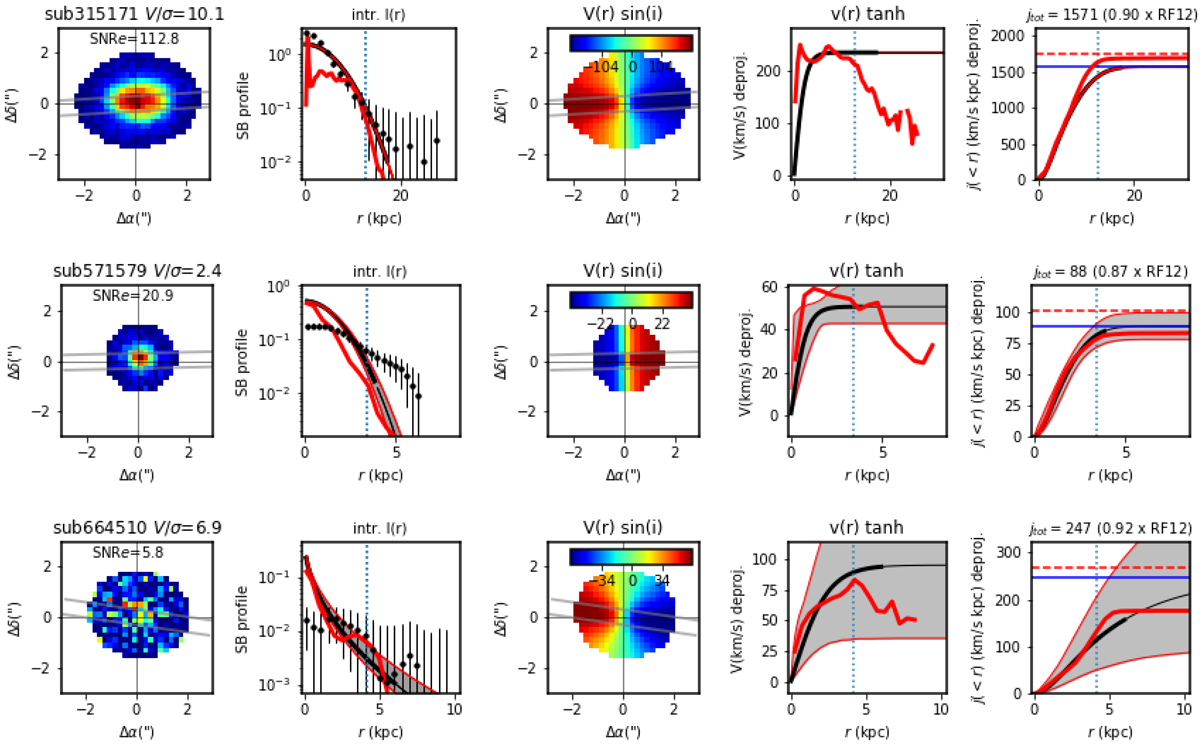
Fig. 5.
Download original image
Example of GAlPAK3D fits for three SFGs from TNG50 shown in Fig. 4. The columns show the flux map, the flux profile Σ(r), the intrinsic velocity field, the deprojected velocity profile and the deprojected angular momentum profile, from left to right respectively. The 1D profiles are computed along the pseudo-slit shown in the first and third columns by the gray lines. In the second column, the SB profile for a single orientation is shown (black points). In the second, fourth and fifth columns, the solid gray curves show the model fits for the various inclinations and orientations. The red solid lines represent the true profiles determined directly from the TNG50 data. The vertical dotted lines represent twice the half-light radius (R1/2,SFR). The horizontal blue lines show the total modeled angular momentum j3D, while the horizontal red lines show the total j from RF12 (Eq. (3)), which can lead to over-estimation of the total angular momentum by 10–20%.
Current usage metrics show cumulative count of Article Views (full-text article views including HTML views, PDF and ePub downloads, according to the available data) and Abstracts Views on Vision4Press platform.
Data correspond to usage on the plateform after 2015. The current usage metrics is available 48-96 hours after online publication and is updated daily on week days.
Initial download of the metrics may take a while.