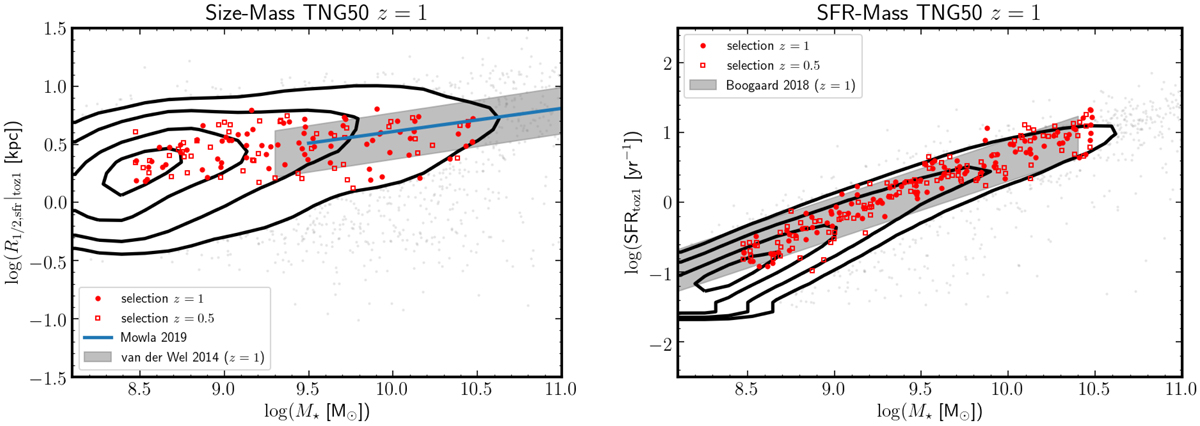
Fig. 3.
Download original image
Sizes and SFRs of the 158 galaxies selected from the overall TNG50 galaxy population. Left: size-mass relation for the selected TNG50 for the mocks where the sizes are half-SFR sizes (calculated in face-on projection and without any dust attenuation). The open (solid) squares represent the z = 0.5 (z = 1) galaxies where the sizes for the z = 0.5 galaxies are adjusted to z = 1 according to the (1 + z)−0.5 evolution found by van der Wel et al. (2014). The background gray points and contours represent the size-mass distribution for the z = 1 TNG50 galaxy population. The solid line (gray band) represents the size-mass relation for late types from Mowla et al. (2019) (van der Wel et al. 2014), respectively. Right: SFR-mass or “main-sequence” relation for the selected TNG50 galaxies (red dots, where SFRs for the z = 0.5 galaxies are adjusted to z = 1 according to the (1 + z)2.2 evolution found by Whitaker et al. 2014). The background gray points and contours represent the SFR-mass distribution for the z = 1 TNG50 galaxy population. For comparison, we show with the gray band the z = 1 main-sequence from the MUSE UDF analysis of Boogaard et al. (2018).
Current usage metrics show cumulative count of Article Views (full-text article views including HTML views, PDF and ePub downloads, according to the available data) and Abstracts Views on Vision4Press platform.
Data correspond to usage on the plateform after 2015. The current usage metrics is available 48-96 hours after online publication and is updated daily on week days.
Initial download of the metrics may take a while.