Fig. C.2.
Download original image
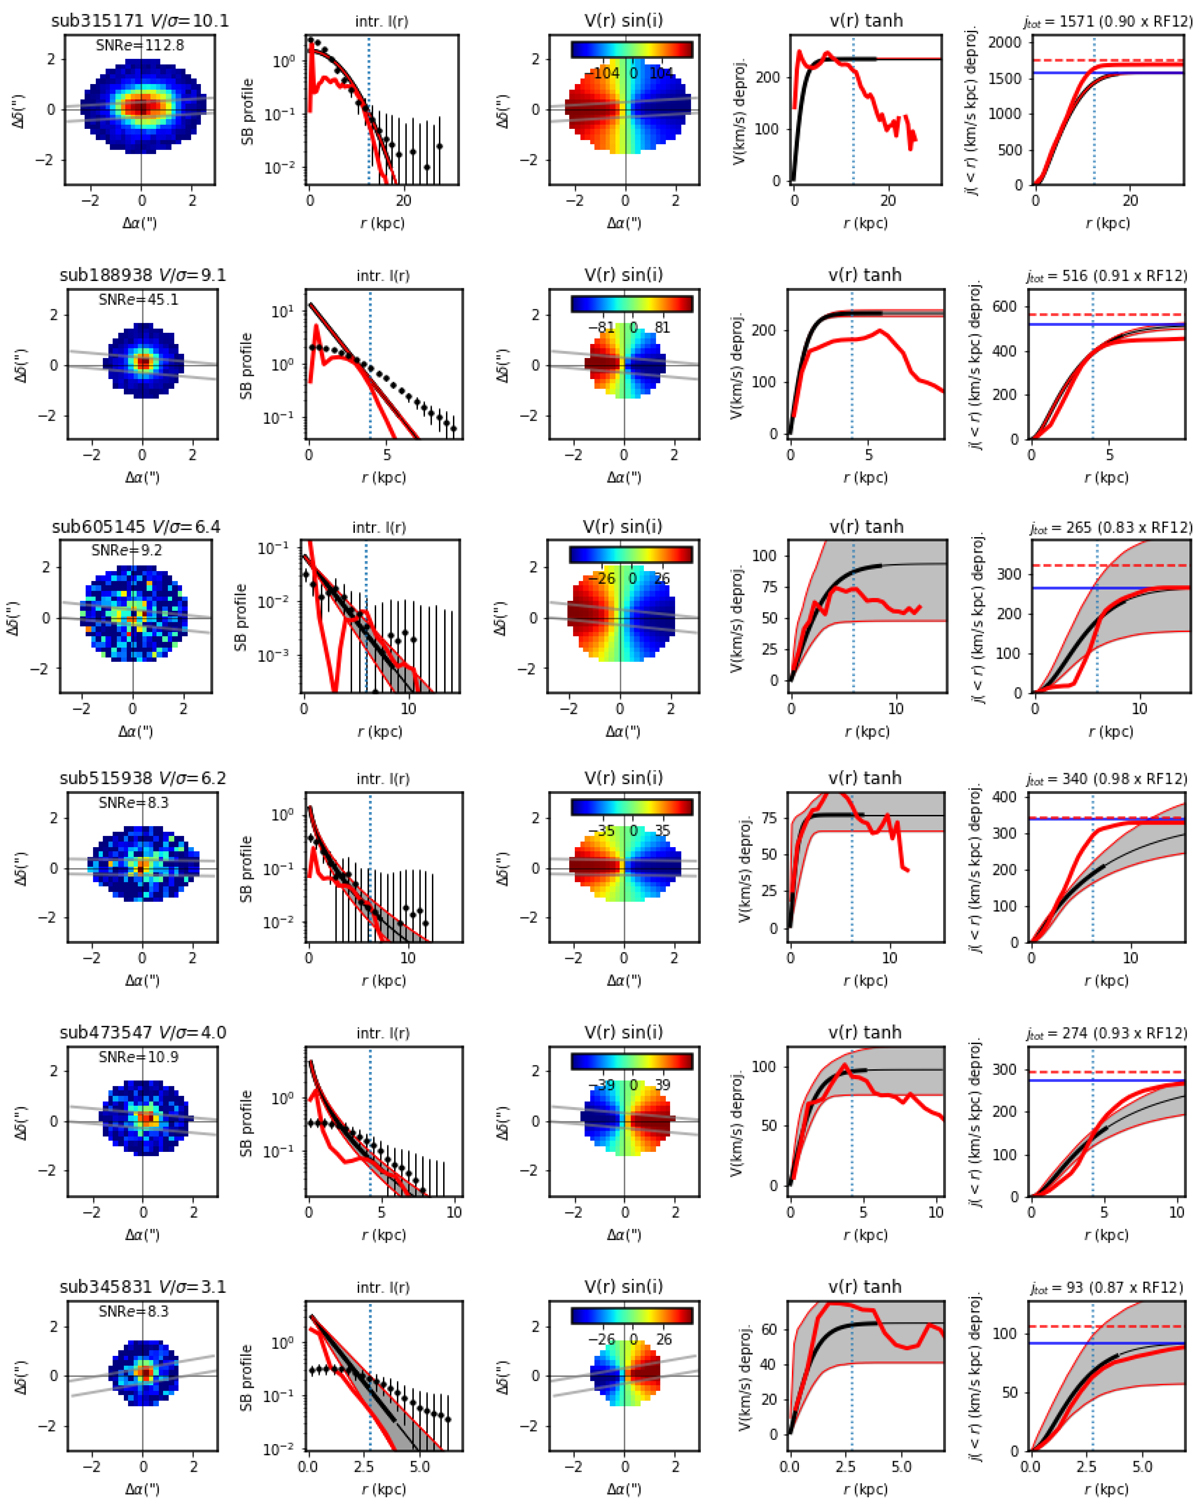
Kinematic properties of some of the TNG50 galaxies. The panels show the flux map, the SB profile ΣSFR, the velocity field, the rotation curve and the SFR-weighted ![]() profiles, respectively. The 1D profiles are determined along the pseudo-long slits represented by the gray straight lines (black solid lines), along with the 95% confidence intervals. The vertical dotted lines represent 2 × Re. The 1D red solid lines represent the true profile determined directly from the TNG50 data. In the last column, the horizontal blue lines show the total modeled angular momentum j3D, while the horizontal red lines show the total
profiles, respectively. The 1D profiles are determined along the pseudo-long slits represented by the gray straight lines (black solid lines), along with the 95% confidence intervals. The vertical dotted lines represent 2 × Re. The 1D red solid lines represent the true profile determined directly from the TNG50 data. In the last column, the horizontal blue lines show the total modeled angular momentum j3D, while the horizontal red lines show the total ![]() using the Eq. (3) formula. This approximation can lead to an over-estimation of the total angular momentum by 10–30% depending on the steepness of the v(r) profile.
using the Eq. (3) formula. This approximation can lead to an over-estimation of the total angular momentum by 10–30% depending on the steepness of the v(r) profile.
Current usage metrics show cumulative count of Article Views (full-text article views including HTML views, PDF and ePub downloads, according to the available data) and Abstracts Views on Vision4Press platform.
Data correspond to usage on the plateform after 2015. The current usage metrics is available 48-96 hours after online publication and is updated daily on week days.
Initial download of the metrics may take a while.