Fig. 13.
Download original image
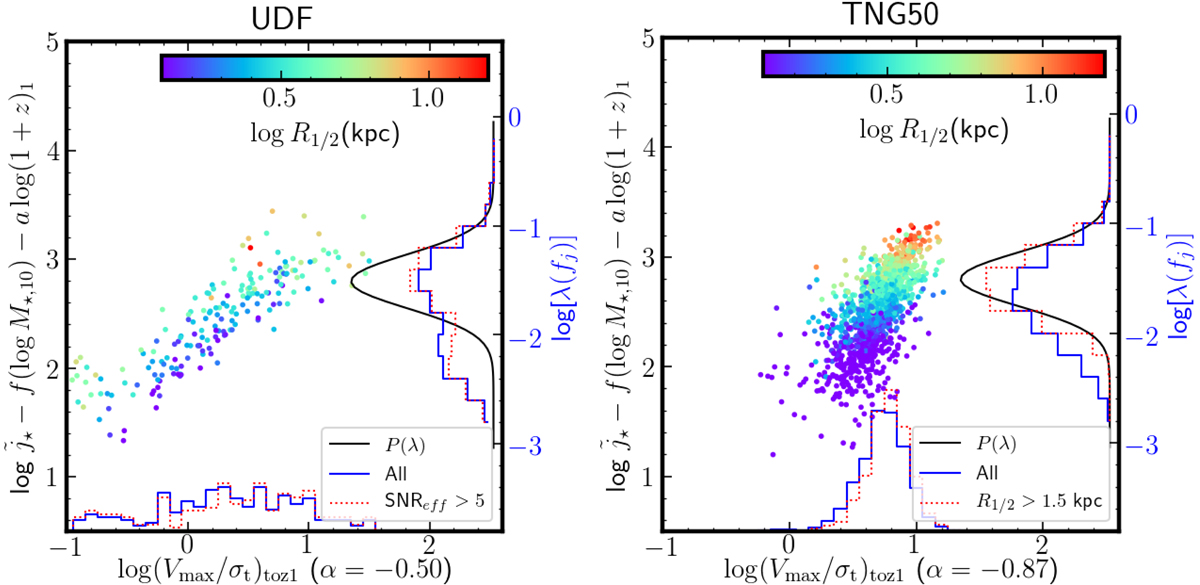
Left: sAM sequence normalization as a function of (V/σt)toz1 for the UDF mosaic sample of SFGs where the color representes the SFR-weighted log R1/2,[O II]. The left y-axis ![]() is found from the fiducial fits shown in Figs. 11–12 (see Table 1). The right y-axis shows the corresponding effective spin λ × fj according to Eq. (8) using the zero-poing of Eq. (8). The solid histograms show the distributions from the data. The solid line shows the log-normal distribution P(λ) expected for halos (Bett et al. 2007). Right: same for the matched TNG50 sample of SFGs.
is found from the fiducial fits shown in Figs. 11–12 (see Table 1). The right y-axis shows the corresponding effective spin λ × fj according to Eq. (8) using the zero-poing of Eq. (8). The solid histograms show the distributions from the data. The solid line shows the log-normal distribution P(λ) expected for halos (Bett et al. 2007). Right: same for the matched TNG50 sample of SFGs.
Current usage metrics show cumulative count of Article Views (full-text article views including HTML views, PDF and ePub downloads, according to the available data) and Abstracts Views on Vision4Press platform.
Data correspond to usage on the plateform after 2015. The current usage metrics is available 48-96 hours after online publication and is updated daily on week days.
Initial download of the metrics may take a while.